Figure 3.

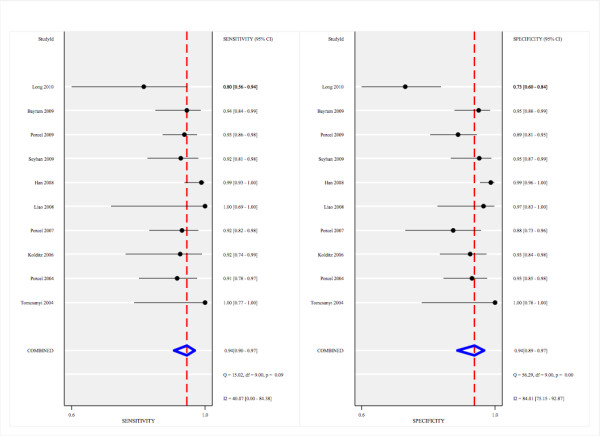
Forrest plot of the sensitivity and specificity of each individual study, pooled sensitivity and specificity, and I2 statistic for heterogeneity.

Forrest plot of the sensitivity and specificity of each individual study, pooled sensitivity and specificity, and I2 statistic for heterogeneity.