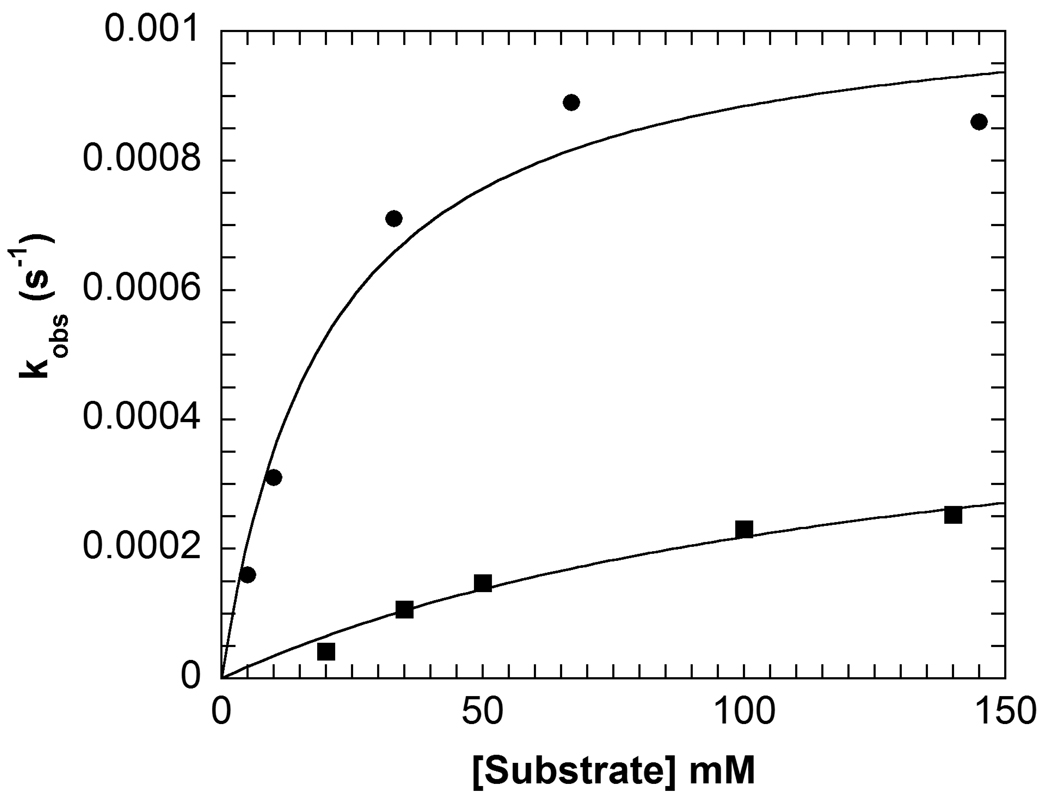
Figure 2.
Concentration dependence of the observed rate constant for the decarboxylation half-reaction with AC5C (circles) and AC6C (squares) in R406M obtained from analysis of multiwavelength data, the lines represent fits to the Michaelis-Menten equation. Experimental conditions: 20 µM enzyme, 100 mM TEA succinate pH 7.8, 100 mM dipotassium succinate, 20 µM PLP, varying concentrations of AC5C or AC6C.

