Figure 3.
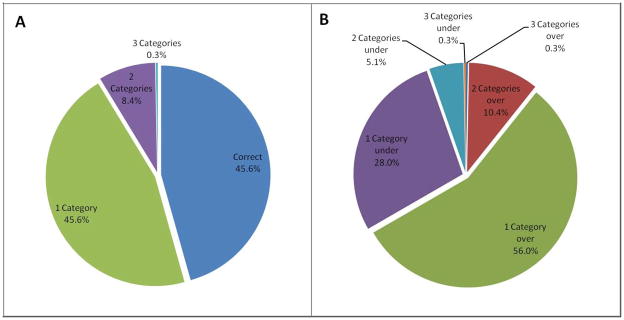
Figure 3A/B. Pie chart representation of PASP clinical category misclassification. Figure 3A represents number of PASP clinical categories misclassified in the total cohort. Figure 3B represents a breakdown of studies with overestimated and underestimated PASP clinical categories. PASP: Pulmonary artery systolic pressure.

