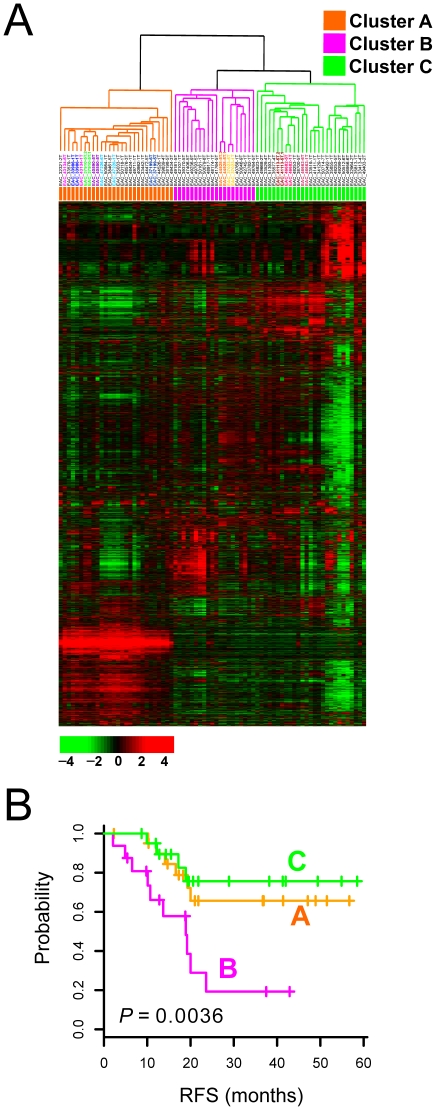
Figure 1. Hierarchical clustering analysis.
(A) Hierarchical clustering of genes from 75 EAC tissues. Genes with an expression ratio that was at least twofold different relative to reference in at least 8 tissues were selected for hierarchical analysis (6,802 gene features). The data are presented in matrix format, with rows representing the individual gene and columns representing each tissue. Each cell in the matrix represents the expression level of a gene feature in an individual tissue. Red and green reflect high and low expression levels, respectively, as indicated in the scale bar (log 2 transformed scale). Duplicated biopsies from the same patients were highlighted in colors in dendrogram. (B) Kaplan-Meier plot of disease-free survival of EAC patients grouped on the basis of gene expression profiling.

