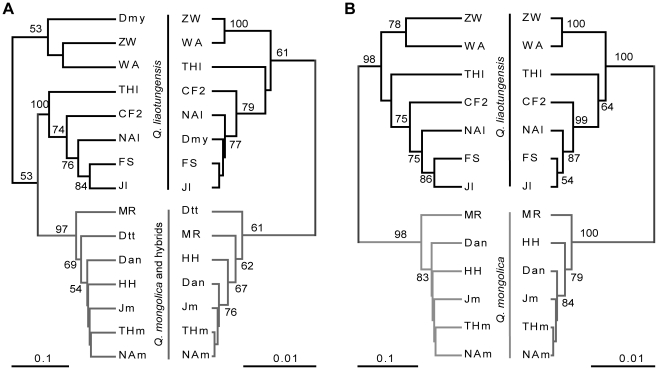
Figure 2. Dendrograms of oak populations based on genetic distance.
(A) With all populations. (B) After excluding the two populations from the Dongling Mountain region. In both panels, left dendrograms are based on genetic distance of 19 SSR loci and right dendrograms are based on genetic distance at 194 AFLP bands. The dendrograms were computed using a UPGMA approach implemented in PHYLIP. Numbers are bootstrap support values.

