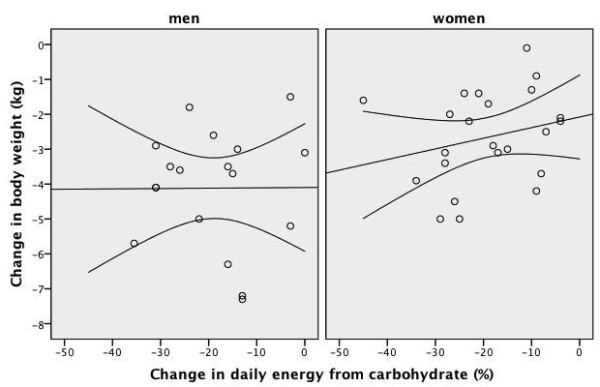
Figure 7.

Scatter plot of the change in daily energy intake from carbohydrate and the change in body weight after four weeks of low-carbohydrate diet in overweight or obese subjects with low HDL-C levels. A line of best fit with 95% confidence intervals is shown. Men were prescribed an 1800 kcal 100-gram carbohydrate diet for four weeks and women were prescribed a 1400 kcal 75-gram carbohydrate diet for four weeks. Change in body weight: weight at week-4 minus weight at baseline Change in daily energy from carbohydrate: daily energy from carbohydrate at week-4 minus daily energy from carbohydrate at baseline
