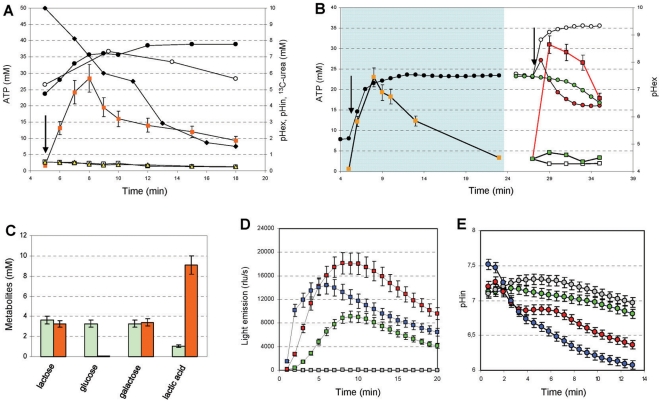
Figure 1. Effects of urea hydrolysis on cellular ATP concentration and homolactic fermentation.
A: Changes in the extracellular pH (pHex) (filled circles), intracellular pH (pHin) (open circles), intracellular ATP concentration (squares), and 13C-urea concentration (diamonds) in a suspension of wild-type S. thermophilus cells without (filled squares) or with (white squares) 10 µM of the urease inhibitor flurofamide during urea hydrolysis. The intracellular ATP concentration was also evaluated in the urease-negative mutant A16(ΔureC3) (triangles). Shaded panel in B: Changes in pHex (circles) and intracellular ATP concentration (squares) during the preparation of energetically discharged cells (EdC). White panel in B: changes in the pHex (circles) and the intracellular ATP concentration (squares) in EdC in the presence of either 10 mM urea (white symbols), 28 mM lactose (green symbols) or both lactose and urea (red symbols). In A and B the addition of urea and/or lactose is indicated by the arrows. C: the consumption of lactose and production of glucose, galactose, and lactic acid in EdC that were activated with lactose (green bars) or lactose and urea (orange bars) under the experimental conditions described in b (white panel). D: the intracellular ATP concentration (reported as light emission) and the intracellular pH, E. MIM945 EdC were activated with 14 mM lactose (green symbols), 14 mM lactose and 0.5 mM urea (red symbols), 14 mM lactose and 1 mM ammonia (blue symbols) or 14 mM lactose and 0.5 mM urea and 0.4 mM sodium oxamate (grey symbols). All of the experiments in this panel were performed in the presence of 100 µg/ml of chloramphenicol to block the protein synthesis. The error bars represent the SEM.

