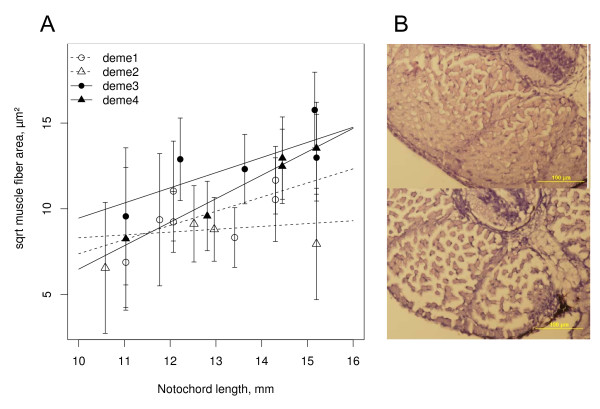
Figure 3.
Differential muscle development in relation to embryo size. A Average (± SD) square root muscle fiber areas (micrometers2) at length for cold vs warm deme post hatch larvae. Lines correspond to deme-wise predictions retrieved from the most supported GLM (see Additional file 2). B. Histological transverse sections from a 13.6 mm cold-deme larva (upper photo) and a 13.4 mm warm-deme larva (lower photo) illustrating the larger, more numerous fibers observed in cold-deme larvae.

