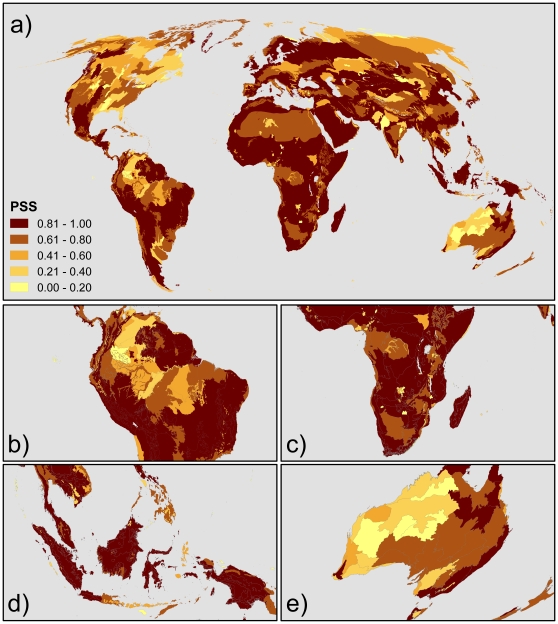
Figure 2. The climatic stability of ecoregions under the A1fi IPCC emission scenario.
The result is based on the average climatic stability from 4 different GCMs. The darker colors represent more stable climates. The climatic stability (a) at the global scale. (b–e) at regional scales; (b) of the Amazon Basin. Western part of Amazon shows higher climatic stability than flood plain. (c) of Madagascar and southern Africa. Montenous area in the East Africa have higher climatic stability. (d) of South east Asian island and New Guinea. The mid elevation areas in this region show very high climatic stability. (e) of eastern Australia. Sub tropical forest has much higher climatic stability than inland desert area.

