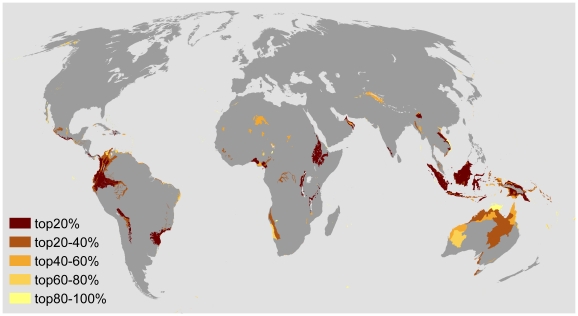
Figure 3. The pattern of accumulated investments.
The result is to minimize species loss from land conversion and climate change under the 20 years allocation with the budget level of 2.5% of the total cost of the available land surface. The categories represent 5 quantiles of the investment amount (top 20%, 20–40%, 40–60%, 60%–80% and 80%∼), where the ecoregions within the top 20% group receive most investment in this particular allocation. The A1fi IPCC emission scenario was applied.

