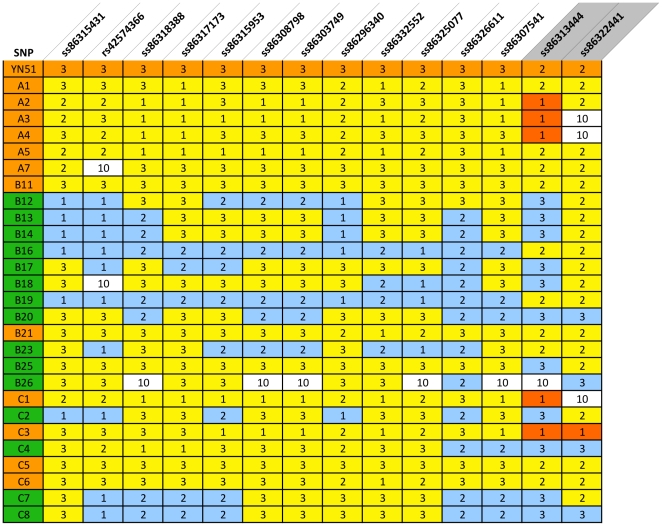
Figure 3. SNPs from the Illumina BovineSNP50 BeadChip that span the region harboring the disease locus.
Genotypes are scored as 1 = AA, 2 = BB, 3 = AB and 10 = missing. Upper orange row represent the SNP genotypes scored in the proband (YN51). All others rows represent half-sib progeny of YN51. Animal IDs in orange indicate animals that inherited the lethal haplotype. Animal IDs in green indicate animals that inherited the normal haplotype. Red fields indicate animals that inherited null alleles. C4 has a recombination, and has the normal haplotype from SNP ss8632661-onwards. Blue fields indicate genotypes not fitting with the mutation-associated haplotype with a deletion. A1–A7 were stillborn calves. B11–B26 represents live calves. C1–C8 represents fetuses. (B11 and B21 represent the two animals that survived despite inheriting the lethal haplotype).

