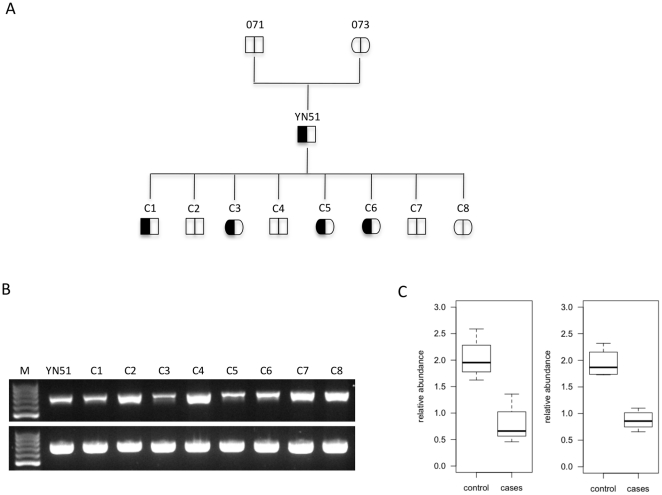
Figure 6. Loss of a MIMT1 parental allele.
A. Proposed (observed) inheritance model for the MIMT1 microdeletion in the progeny of Finnish Ayrshire bull (Bos taurus). The deletion allele is denoted as a filled field, the normal allele as an open field. B. Agarose gel analyses of target and control PCR products demonstrating the amplification of either one or two genomic DNA copies. PCR product (737 bp) amplified with primer pair localized at the 3′end of MIMT1 - upper picture. YN51, C1, C3, C5, C6 show PCR amplification from a single template chromosome; C2, C4, C7, C8 show PCR amplification from two template chromosomes. PCR (763 bp) of control amplification (lower picture) with primer pair localized in intron 2 of the PEG3 gene. C. qPCR quantification of two different genomic regions within MIMT1 locus calculated using the 2∧(1+ (-ΔΔct)) formula. Amplicon localized in exon 3 (left panel), and in 3′end of MIMT1 (right panel). Genomic fragments on BTA26 with confirmed double-copy amplification, and BTA5 were used as control regions.

