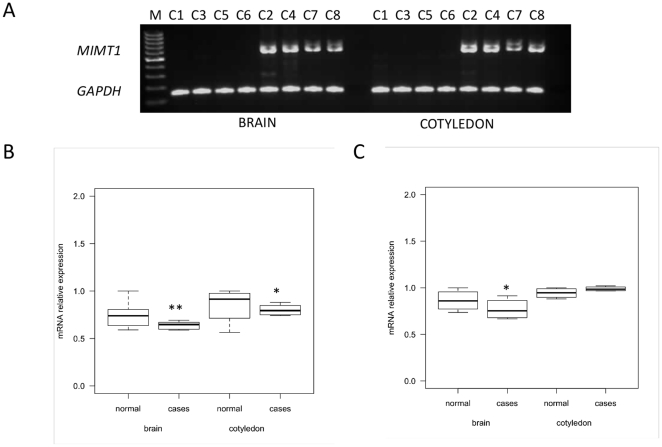
Figure 7. Expression analysis of the bovine PEG3, MIMT1 and USP29 genes.
The fetal brain and cotyledon tissues were studied in four fetuses (C1, C3, C5, C6) that inherited the microdeletion chromosome from YN51 and four, which inherited the alternate normal chromosome (C2, C4, C7, C8) A. RT-PCR analysis of MIMT1 gene. Due to the alternatively spliced exon 2 of MIMT1 gene, two different-sized bands are visible in control fetuses. No product was detected in carrier fetuses. GAPDH RT-PCR was used for confirmation of reverse transcription efficiency. B. Box plot showing qPCR analysis of PEG3 between control and case group. C. Box plot showing qPCR analysis of USP29. qPCR expression is shown as a relative level of mRNA calculated with the 2∧(-ΔΔct) formula and using GAPDH as an internal control gene. pValue * <0.05, ** <0.01.

