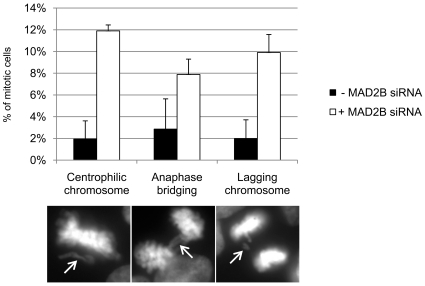
Figure 4. MAD2B depletion leads to mitotic defects.
HEK293/T-REx/pSUPERIOR-MAD2B cells were transiently transfected with a H2B-RFP construct (see Materials and methods) and grown with or without tetracyclin (+/− MAD2B siRNA), respectively. Subsequently, mitotic cells were scored for misaligned chromosomes. Percentages of cells with misalignments, such as centrophilic chromosomes, anaphase bridges and lagging chromosomes, are shown in the histogram. Black bars represent cells normally expressing MAD2B (- MAD2B siRNA; see Fig. 3, t = 0), and white bars represent MAD2B depleted cells (+MAD2B siRNA; see Fig. 3, t = 4). In the lower panels examples of centrophilic chromosomes, anaphase bridges and lagging chromosomes are shown (arrows).

