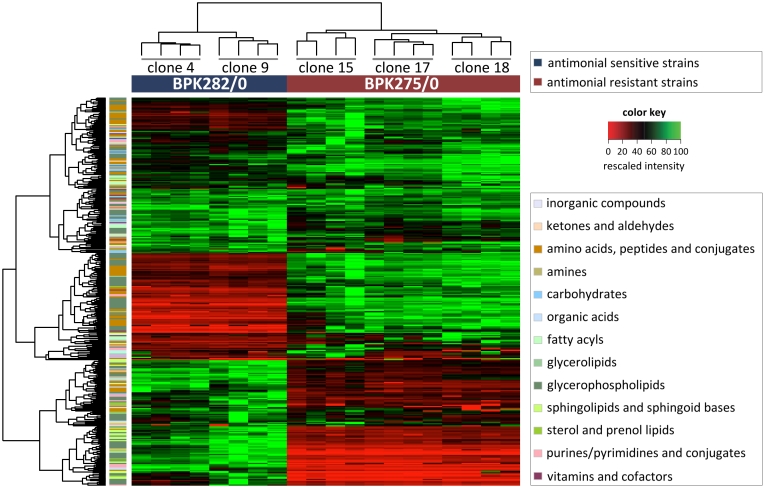
Figure 2. Metabolic profiles of the 340 identified compounds in heatmap format.
The samples are presented along the x-axis. On the left, the 4 biological replicates are present adjacent to each other for clones 4 and 9 derived from the drug-sensitive clinical isolate BPK282/0. On the right, the 4 biological replicates are present adjacent to each other for clones 15, 17 and 18 derived from the drug-resistant clinical isolate BPK275/0. The 340 detected metabolites are presented along the y-axis; the major classes of metabolites are colour-coded on the left. The intensity of each metabolite detected in the sample set was rescaled between 0 (red) to 100 (green). Unsupervised hierarchical clustering of the samples (the tree above the x-axis) reveals that the metabolite intensity profiles differ sufficiently to clearly and robustly distinguish the separate clones of the drug-resistant and drug-sensitive isolates. Among the samples from the same isolate, the biological replicates from individual clones are also correctly clustered together. Clustering of the metabolites according to similarity in intensity profiles (the tree left of y-axis), reveals several large groups of metabolites that are either significantly higher or lower in the drug-resistant samples (quantitative data and identification/classification of all compounds included in this figure can be found in Table S1).

