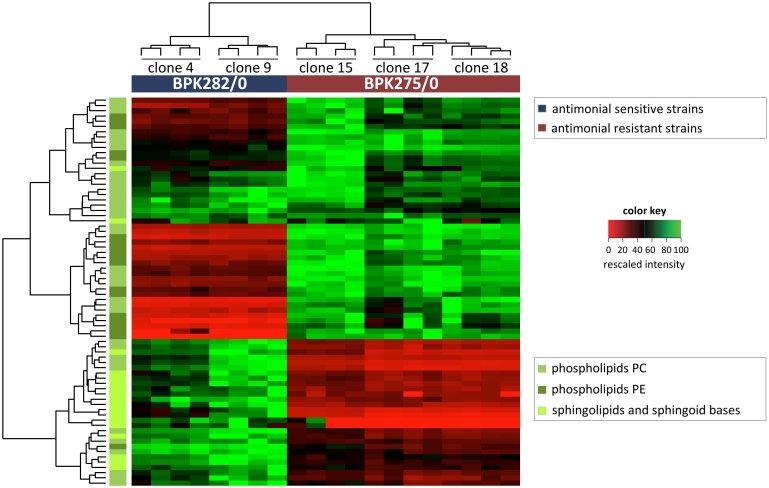
Figure 5. Profiles of phosphatidylethanolamines (PE), phosphatidylcholines (PC), sphingolipids and sphingoid bases in heatmap format.
The layout is similar to Figure 2. Unsupervised hierarchical clustering of the samples (the tree above the x-axis) reveals that the lipid intensity profiles differ sufficiently to separate the drug-resistant and drug-sensitive clones. The lipid classes are colour-coded on the left. A shift towards PE content characterises drug-resistant parasites, while sphingolipids and sphingomyelins are less abundant in drug-resistant parasites (For PC and PE, only lipids with 2 acyl/alkyl side chains and an even number of side chain carbon units were included).

