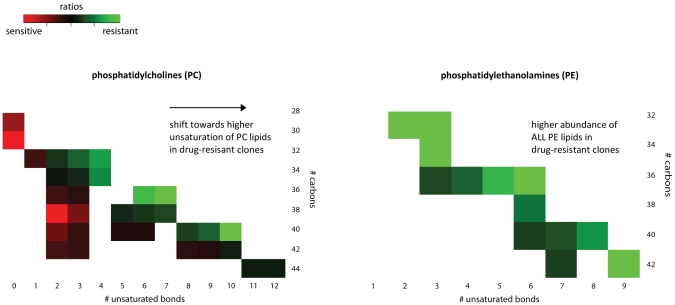
Figure 6. Structural properties of phosphatidylethanolamines and phosphatidylcholines.
The heatmaps show a graphical overview of the fatty acyl (FA) structural properties in diacyl ester phosphatidylcholines (left panel) and diacyl ester phosphatidylethanolamines (right panel). The x-axis shows the total number of unsaturated bonds present in the 2 fatty acyl chains, while the y-axis shows the length of the fatty acyl chains in total number of carbon units. The heatmap intensity of a particular lipid species corresponds to the ratio of the detected average abundance in drug-resistant versus drug-sensitive clones of that lipid. Hence, lipids indicated in red are more abundant in drug-sensitive clones, while lipids in green are more abundant in drug-resistant clones.

