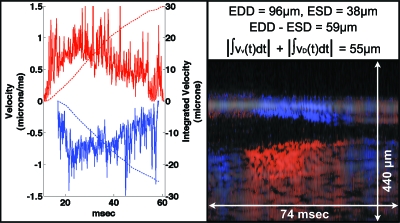
Figure 4.
Dorsal and ventral heart wall velocity (left panel) during systole as measured using M-mode Doppler OCT (lower-right panel). These representative velocity curves were obtained by plotting the maximum (ventral wall) or minimum (dorsal wall) wall velocity at each time point (i.e., M-mode line) from a manual region of interest drawn on each heart wall. Red curves are ventral data, and blue curves are dorsal data. Solid curves represent velocity data, while dashed curves represent displacement (i.e., integrated velocity) data. The upper-right panel shows the equations governing change in chamber diameter measured using structural OCT and calculation of displacement using Doppler velocimetry data. The structural OCT image is shadowed over the Doppler M-mode image. The red∕blue (i.e., positive∕negative Doppler shift) color map used here is distinct from that used in the other figures and has a very limited dynamic range in order to accentuate the sign, as opposed to the magnitude, of the Doppler shift. EDD, end-diastolic diameter; ESD, end-systolic diameter; vv(t), time-varying ventral wall velocity; vD(t), time-varying dorsal wall velocity.

