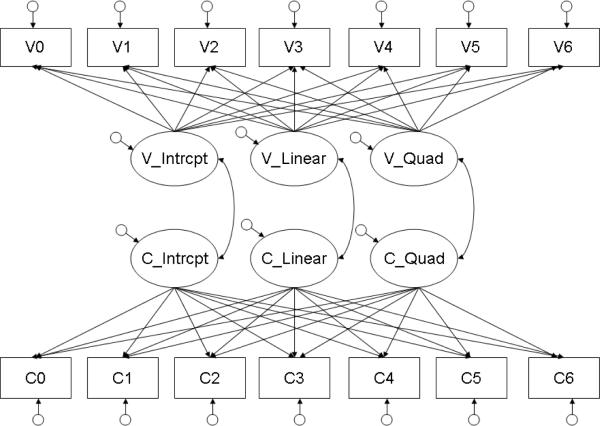
Figure 2.
Structure of the Joint growth curve models of CMRS-P change and change in YMRS measures. Note: * p < .05. ** p < .01. Variables C0 through C6 are CMRS-P measures, and variables V0 through V6 is the validity measure (YMRS). Similarly, “C” latent variables represent growth in the CMRS-P, and “V” latent variables represent growth in the validity measure.

