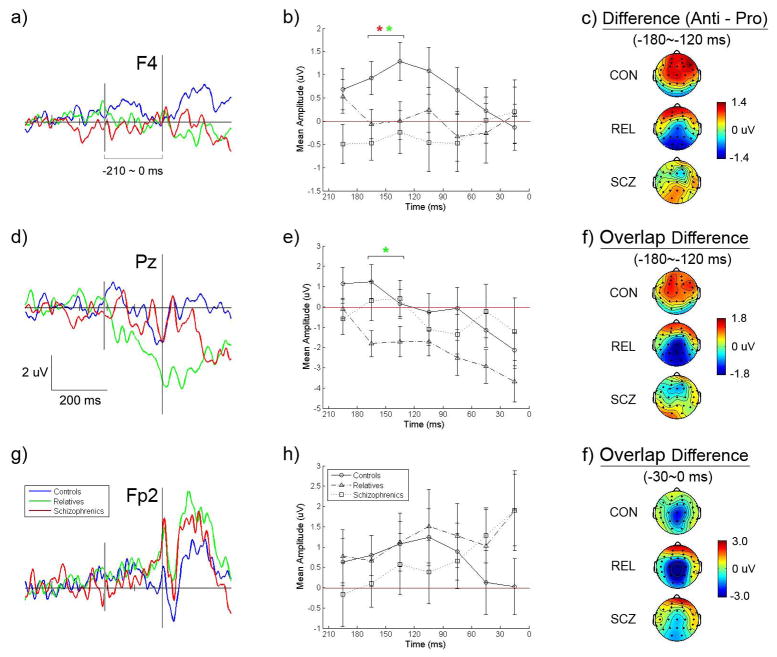
Figure 2.
Grand averages of difference potentials (antisaccade – prosaccade) for schizophrenia patients, biological relatives of schizophrenia patients, and control subjects preceding saccadic eye movements. Potentials are displayed for three electrodes (left panel) and mean difference amplitudes are depicted across 7 time ranges in 30 ms intervals (middle panel) to show voltage change across time (See text for further descriptions. Note: In contrasts of the patients to the controls, * = p<.05; in contrasts of the relatives to the control, * = p<.05).

