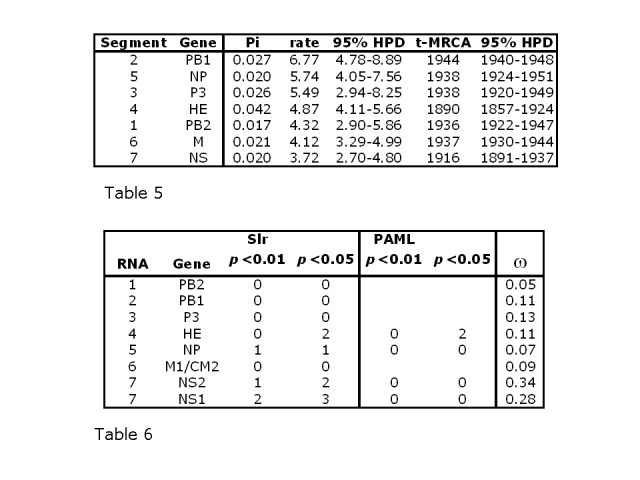
Table 5: Nucleotide substitution rates in substitutions x 10-4 per site per year and time of most recent common ancestor (t-MRCA) with their respective 95% highest posterior densities (HPD). Segments are arranged in descending order of substitution rate. Pi: average number of substitutions per site in the alignment. The correlation coefficient between variability and t-MRCA is 0.74 (significant at p<0.05), suggesting that sequence diversity accumulates with age.
Table 6: Positive selection analysed using Slr and PAML, showing numbers of sites predicted to be under positive selection at 5% and 1% significance levels. PAML was only run where Slr initially gave a positive score. ω: average non-synonymous to synonymous substitution rate ratio (dN/dS) for each alignment (omega).

