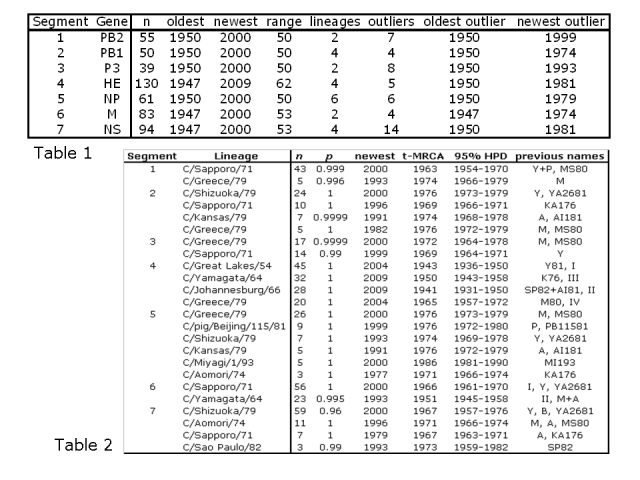
Table 1: Age distribution of sequences, number of lineages and age distribution of outliers (sequences not falling within lineages). n: number of sequences.
Table 2: Lineages identified by Bayesian analysis. n: number of strains in lineage; p: Bayesian posterior probability of monophyletic clade; newest: the date of the most recent strain identified in each lineage; t-MRCA: the mean date (in years of the Common Era, i.e. AD) of the most recent common ancestor of each lineage; 95% HPD: the 95% highest posterior densities of the date of the t-MRCA; previous name: the previous designations given to the lineages in the literature [3] [4] [8] [10] [12].

