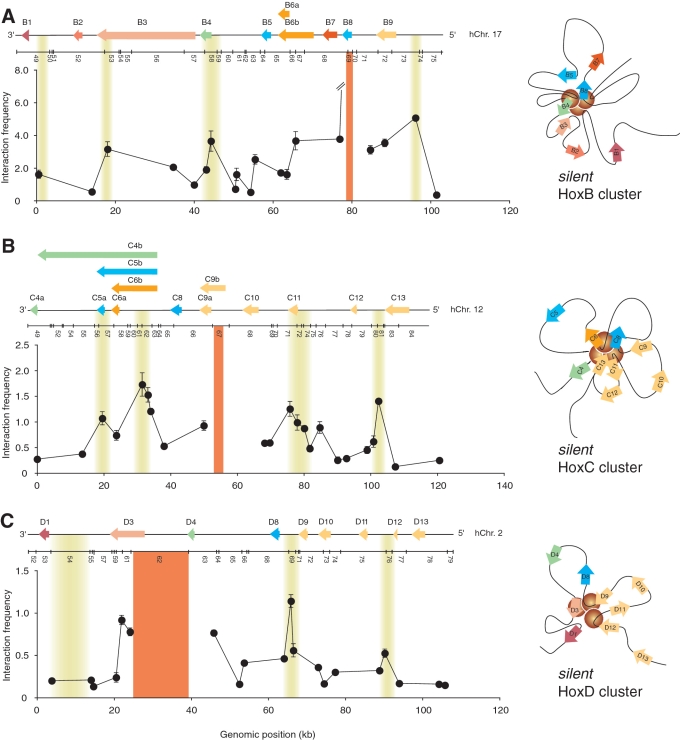
Figure 2.
Chromatin looping is a conserved feature of transcriptionally silent Hox clusters. (A) The silent HoxB cluster is organized into a distinct set of looping contacts. (left panel) Representative ‘fixed’ 3C interaction profile illustrating looping contacts. The looping interactions shown are specific to the HoxB cluster. The y-axis indicates normalized interaction frequency. The x-axis shows genomic position relative to the start of the cluster. Line break in graph highlights out of range value. A linear diagram of the HoxB cluster and the predicted BglII restriction pattern are shown to scale above the graph. Cluster features are as described in Figure 1A. Solid orange vertical line identifies the position of ‘fixed’ 3C region. Shaded yellow areas highlight the position of looping contacts. Each data point is the average of at least three PCRs. Error bars represent the standard error of the mean. (right panel) Predicted two-dimensional representation of the silent HoxB cluster. Note that the yellow circles simply highlight an area encompassing looping contacts and not the number of interactions. The model is based on the heatmap results presented in Figure S2 and is as described in Figure 1C. (B) The silent HoxC cluster is organized into multiple chromatin loops. (left panel) The representative 3C interaction profile from a ‘fixed’ HoxC region illustrates DNA looping specific to the cluster and is as described in (A). (right panel) The two-dimensional model of the transcriptionally silent HoxC cluster is based on the heatmap results presented in Figure S3 and is as described in Figure 1C. Yellow circles highlight an area containing looping interactions. (C) The silent HoxD cluster is organized into multiple looping contacts. (left panel) The 3C interaction profile from a ‘fixed’ HoxD region shows looping contacts specific to HoxD and is as described in (A). (right panel) The two-dimensional model of the transcriptionally silent HoxD cluster is based on the heatmap results presented in Figure S4 and is as described in Figure 1C. The area containing looping interactions is highlighted with yellow circles.

