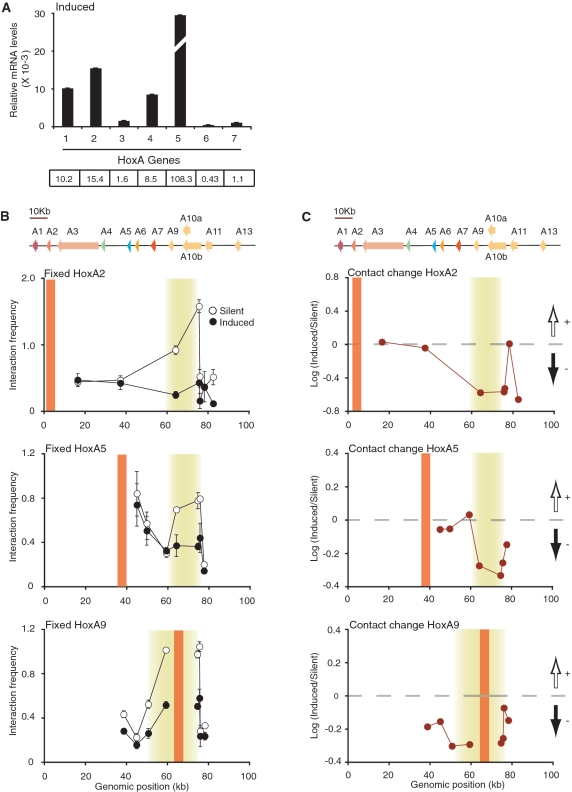
Figure 3.
The silent HoxA conformation is dependent on transcription activity. (A) Quantitative real-time PCR analysis of HoxA genes following RA induction in NT2/D1 cells. Steady-state HoxA mRNA levels were normalized relative to actin. Histogram break in HoxA5 highlights out of range value. Number below histogram bar identify HoxA paralog group. Values shown below each paralog group represent corresponding relative mRNA levels (×10−3). Quantifications are derived from at least three PCRs and error bars show SD. (B, C) Fixed 3C interaction profile of HoxA2 (top), HoxA5 (middle) and HoxA9 (bottom) genes in transcriptionally silent and RA-induced NT2/D1 cells. Schematic representation of the HoxA cluster is presented above graphs and is to scale. 3C interaction frequency is presented in (B). RA-induced chromatin contact changes are presented in (C). Black and white vertical arrows above and below horizontal dashed lines represent gain and loss of contacts in induced cells, respectively. Vertical orange lines indicate position of fixed primer and shaded yellow areas highlight looping contacts. Individual interaction frequencies were derived from at least three PCRs. Error bars show standard error of the mean (SEM).

