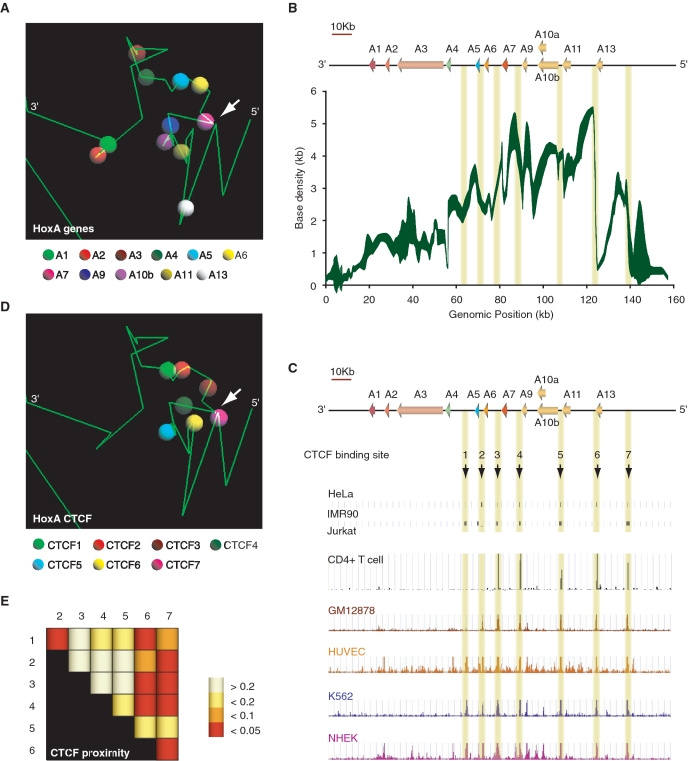
Figure 5.
Three-dimensional modeling of the silent HoxA cluster identifies CTCF as a likely candidate mediating chromatin loops. (A) Example of a 5C3D output model of the transcriptionally silent HoxA cluster. Green lines represent genomic DNA, and vertices define boundaries between consecutive restriction fragments. Colored spheres as indicated in the legend below identify the transcription start site of corresponding paralog group. (B) Three-dimensional local base density scan of the transcriptionally silent HoxA cluster. Local base densities at consecutive 10 bp was estimated in 100 possible 5C3D outputs models with Microcosm 1.0 (y-axis) and represented graphically along the corresponding genomic region (ENCODE hg18 Chr7:27079118 to 27236536) (x-axis). The weight of the trace is proportional to the standard deviation with sharper areas indicating smaller deviations. (C) CTCF binds to multiple discrete sites conserved in various cell lines at the 5′-end of the HoxA cluster. Conserved CTCF sites are highlighted by yellow vertical lines. (D) Conserved CTCF binding sites are clustered three-dimensionally at the 5′-end of the HoxA cluster. The position CTCF binding sites numbered in (C) are illustrated in the example 5C3D output model presented in (A). CTCF binding sites are represented by colored spheres as indicated in the legend below. (E) CTCF binding sites are significantly close to each other in three-dimensional models. Distances between pairs of CTCF binding sites were measured with Microcosm 2.0. and expressed as P-values summarized in a heatmap. Numbers at the top and on the left of heatmap identify CTCF binding sites. Intersecting column and row number identifies the CTCF pair. P-values are color-coded based on the scale presented on the right. P-values were calculated as described in ‘Materials and Methods’ section.

