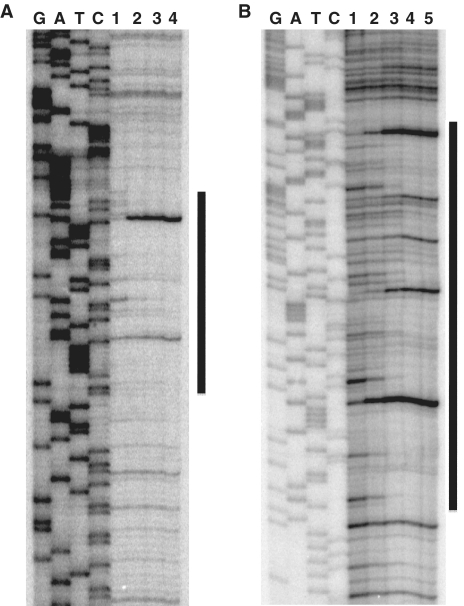
Figure 3.
GnfM-binding site. Footprint assays were carried out with GnfM and the upstream region of gnfK (A) or gdhA (B). DNA-binding reactions were conducted with GnfM (lane 1, 0 pmol; lane 2, 0.7 pmol; lane 3, 1.3 pmol; lane 4, 2.5 pmol for gnfK, lane 1, 0 pmol; lane 2, 0.3 pmol; lane 3, 0.7 pmol; lane 4, 1.3 pmol; lane 5, 2.5 pmol for gdhA) and probes (0.2 pmol). G, A, T and C represent sequence ladders. The region protected from or modified by DNase I in the presence of GnfM is indicated by a vertical bar.

