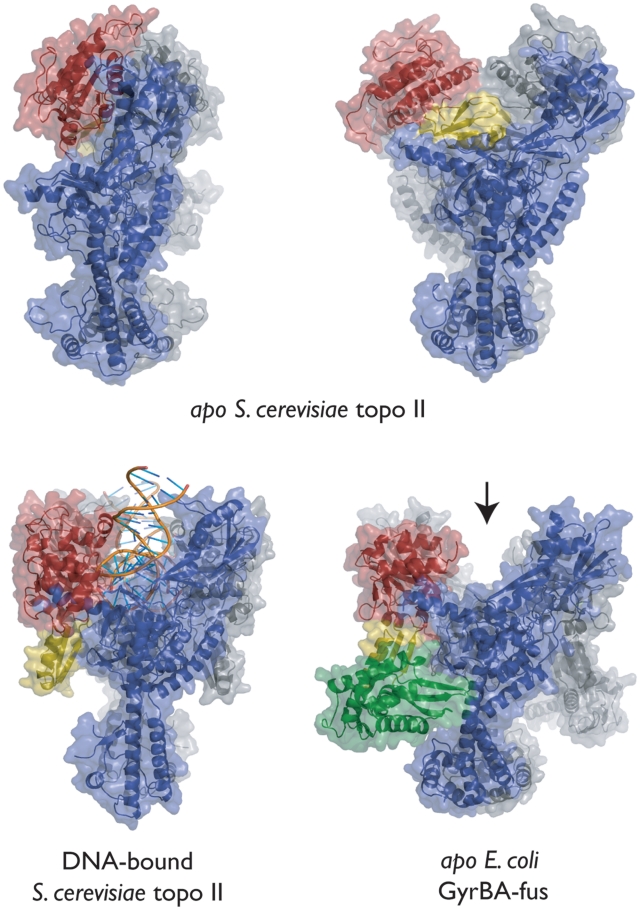
Figure 4.
Relative TOPRIM orientations. Side view of GyrBA-fus (lower-right panel) shown next to models for three other conformations of the type IIA topo DNA binding and cleavage core (top two panels—apo S. cerevisiae topo II, PDB ID BGW and PDB ID 1BJT; lower left panel—DNA-bound S. cerevisiae topo II, PDB ID 2RGR). The arrow marks the open G-segment-binding channel in GyrBA-fus. One protomer of each dimer is colored gray; the other is colored as per Figure 1A.

