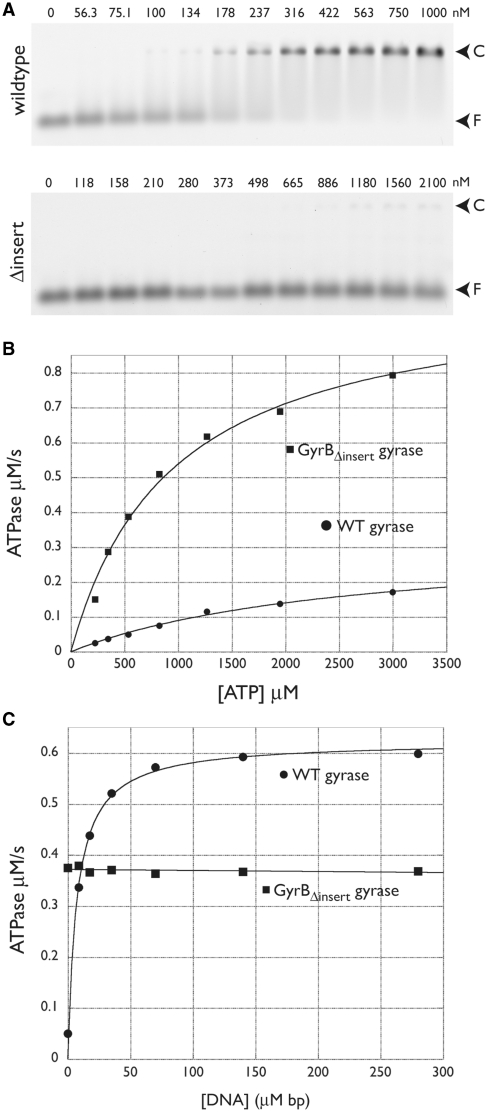
Figure 6.
DNA binding and ATPase activity of wild-type and GyrBΔinsert gyrase. (A) EMSAs. Titration of wild-type GyrB:GyrAΔCTD is shown at top; the GyrBΔinsert:GyrAΔCTD construct, at bottom. Arrows indicate the positions of free DNA (F) and DNA-protein complex (C). Values above each lane indicate the amount of tetramer in nM. (B) Basal ATPase activity. Wild-type and GyrBΔinsert gyrase activities are plotted as a function of ATP concentration and fit to a standard Michaelis–Menten kinetic model. (C) DNA-stimulated ATPase activity. Wild-type and GyrBΔinsert gyrase activities at a constant ATP concentration are plotted as a function of sheared salmon sperm DNA concentration. Data for wild-type gyrase are fit to a single-site binding equation; GyrBΔinsert gyrase data are fit to a line.

