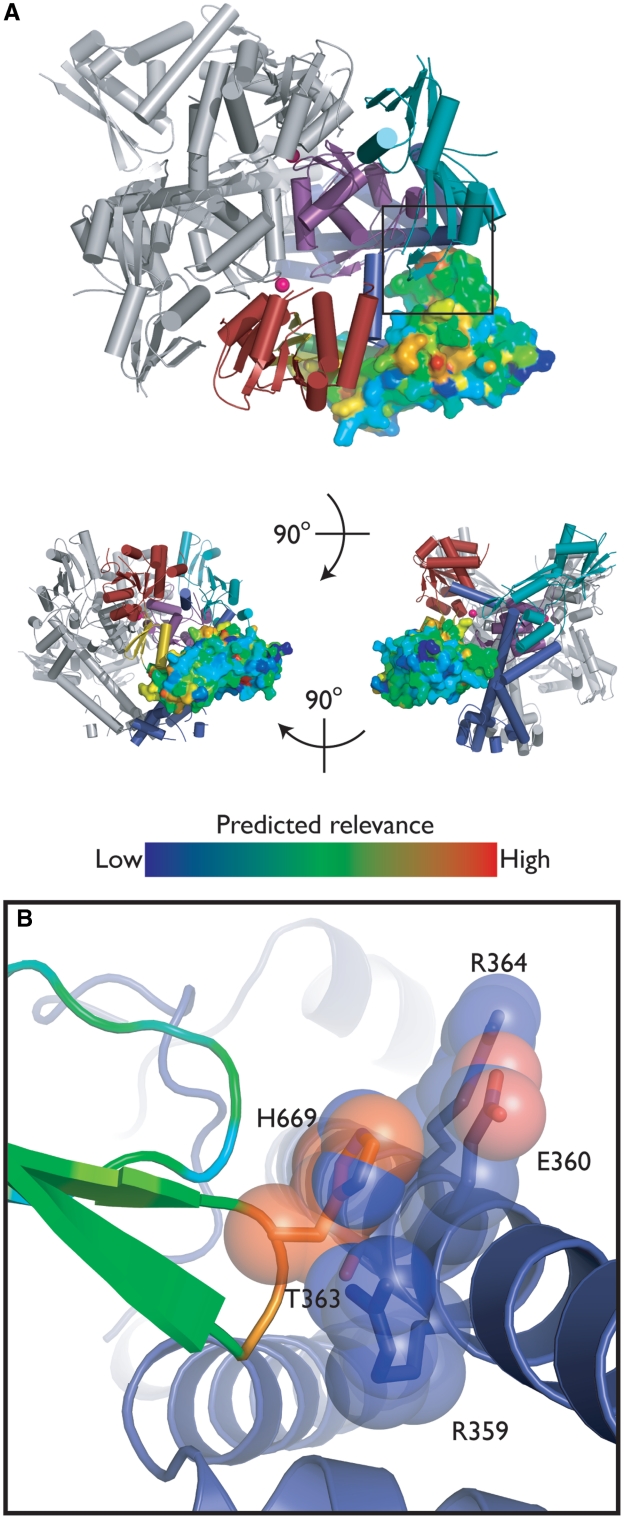
Figure 7.
Insert/GyrA interactions. (A) INTREPID analysis. The structure of GyrBA-fus is shown as in Figure 2, except the insert is displayed as a surface model and colored by INTREPID score (Supplementary Table S1) (62). (B) GyrB His669 contacts GyrA. The GyrB insert is shown colored by INTREPID score; the GyrA coiled-coil is shown in blue. Selected amino acids in close proximity are shown in stick/transparent spheres representation and colored by atom.

