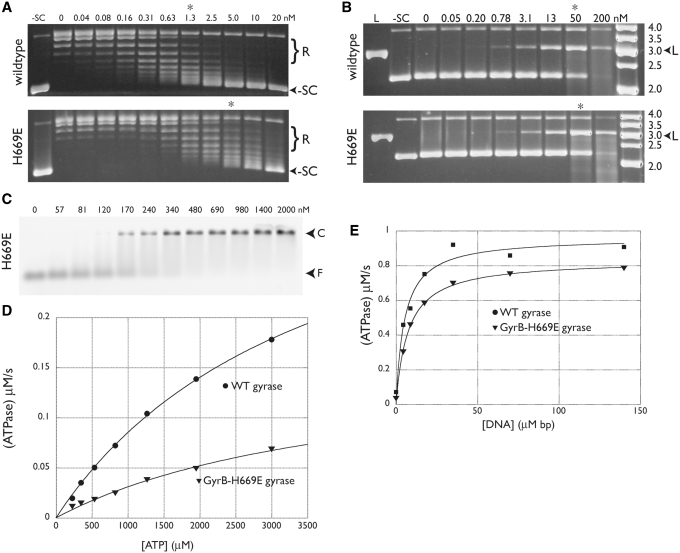
Figure 8.
GyrB H669E activities. Negative supercoiling assays (A) and ciprofloxacin-dependent DNA cleavage assays (B) are shown and labeled with the enzyme (wild-type or GyrB-H669E gyrase) used in each titration. Positions of relaxed and supercoiled species are indicated, as are lanes with negatively supercoiled (–SC) or BamHI-linearized (L) plasmid standards. The concentrations of gyrase tetramer (in nM) are also shown. Asterisks indicate lanes with comparable activity for each pair of gels. In the cleavage assay (B), the rightmost lane contains a DNA ladder (O’GeneRuler, Fermentas) with the standard sizes (in kb) indicated. (C) DNA binding. Arrows indicate the positions of free DNA (F) and protein-DNA complex (C) in the EMSA. Values indicate the amount of tetramer in nM. (D) Basal ATPase activity. The ATPase activities of wild-type (circles) and GyrB–H669E (triangles) gyrase are plotted as a function of ATP concentration and fit to a standard Michaelis–Menten kinetic model. (E) The ATPase activities of wild-type (circles) and GyrB–H669E (triangles) gyrase at a constant ATP concentration are plotted as a function of increasing amounts of sheared salmon sperm DNA. Data are fit to a single-site binding equation.

