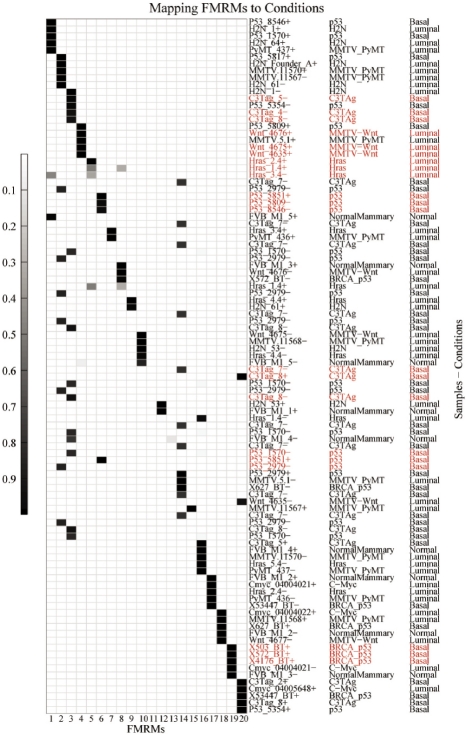
Fig. 2.
Assigning biological conditions to FMRMs. The y-axis on the right side of the figure denotes sample names, mouse model types and breast cancer subtypes in three columns. Using the parameter Θ, the likelihood that a particular sample is associated with a specific module, the top 5% samples associated with each module are displayed using the grey scale. These samples are considered to map modules to biological conditions. Samples may occur more than once in the y-axis because some samples are significantly associated with more than one module. Some modules, such as module-11, have only rather low probability of association with samples, and thus have nearly white shading even for their top five samples. Significant mapping of FMRMs to conditions is highlighted.

