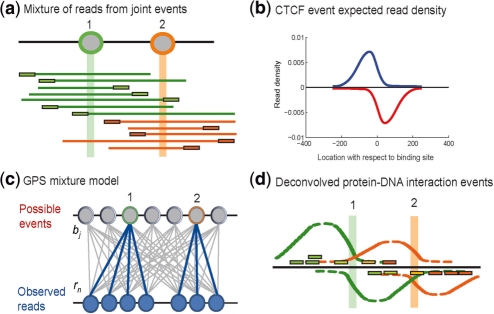
Fig. 1.
GPS probabilistically models ChIP-Seq read spatial distributions. (a) Protein-DNA interaction events at positions 1 and 2 on the genome result in DNA end sequence reads in the ChIP-Seq protocol. (b) The observed spatial read density (blue: ‘+’ strand, red: ‘−’ strand) from ∼4000 CTCF events aligned with respect to the CTCF motif position at each event (c) GPS models ChIP-Seq reads as being generated by a mixture of binding events at every genomic base, with each event producing the characteristic spatial read density. (d) A sparse prior on mixture components causes GPS to assign events to as few bases as possible to explain the observed reads (green and orange reads). In GPS, a given read can be explained by more than one event (yellow reads).

