Figure 3.
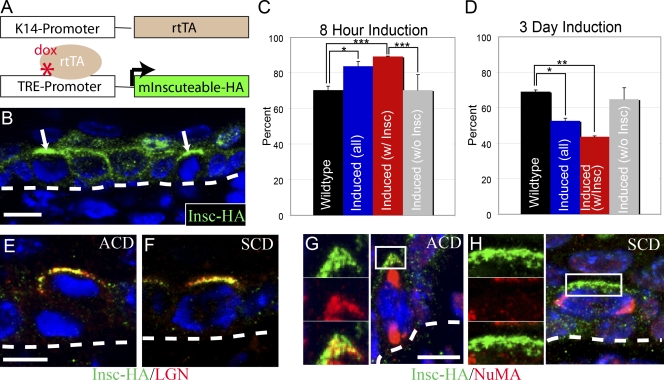
mInsc expression is sufficient for transient but not long-term increases in ACD. (A) Diagram of genetic induction system. K14-rtTA mice were mated to mice expressing mInsc-HA under the control of TRE. (B) With both alleles and doxycycline present, mInsc-HA (green) is expressed in the epidermis. Arrows indicate apical accumulation of mInsc-HA in mitotic cells. Hoeschst labels nuclei (blue). (C) Quantification of mitotic spindles oriented perpendicular to the basement membrane in embryos induced to express mInsc-HA for 8 h. Expression of mInsc-HA was mosaic so data are presented for all cells (induced(all)), only cells with detectable apical mInsc-HA (induced(w/Insc)), and cells without detectable mInsc-HA (induced(w/o Insc)). P-value for wild-type versus induced (all) cells is 0.017, wild-type versus induced (w/mInsc) is 0.0002, and induced (w/mInsc) versus induced (w/o mInsc) is 0.0005. (D) Quantification of mitotic spindles oriented perpendicular to the basement membrane in embryos induced to express mInsc-HA for 3 d. P-values are 0.017 for wild-type versus induced (all) cells and 0.003 for wild-type versus induced (w/ mInsc) cells. There was no statistically significant difference between either induced (w/o mInsc) and induced (w/mInsc) or wild-type cells. (C and D) Error bars indicate mean ± SEM. (E and F) Colocalization of mInsc-HA (green) and LGN (red) at the apical cortex of mitotic cells dividing either asymmetrically (E) or symmetrically (F). (G) mInsc-HA (green) colocalizes with NuMA (red) at the apical cortex of an asymmetrically dividing cell. (H) Lack of colocalization of mInsc-HA (green) and NuMA (red) in a symmetrically dividing cell. (G and H, left) Higher magnification views of boxed areas are shown. Dashed lines indicate the basement membrane. *, P < 0.05; **, P < 0.01; ***, P < 0.001. Bars, 10 µm.

