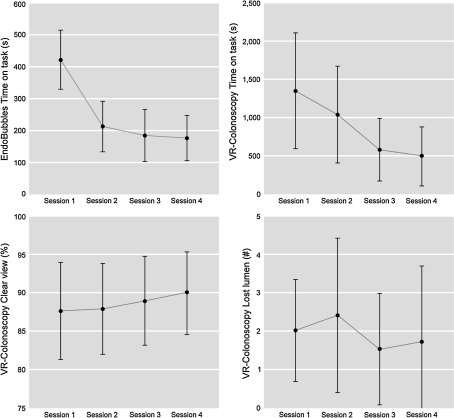
Fig. 2.
Means and standard deviations for the analyzed performance variables, for all sessions and both tasks. Top left EndoBubbles task (time on task), top right VR-colonoscopy task (time on task), bottom left VR-Colonoscopy task (percentage of time spent with clear view), bottom right VR-Colonoscopy task (number of times lumen was lost from view)

