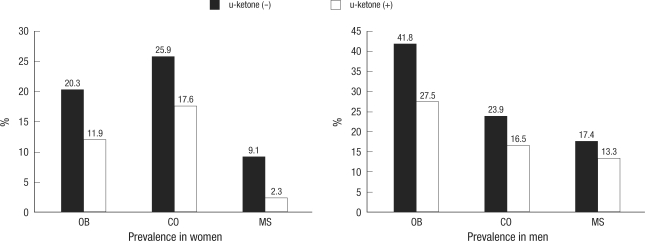
Fig. 1.
Prevalence of obesity, central obesity, and metabolic syndrome according to the presence of ketonuria in all subjects. This figure is representing the prevalence of obesity, central obesity, and metabolic syndrome according to the presence of ketonuria and all showed statistically significant difference (P<0.05) in both genders.
OB, obesity (body mass index ≥25.0 kg/m2); CO, central obesity (men ≥90 cm, women ≥85 cm); MS, metabolic syndrome followed by NCEP-ATP III.

