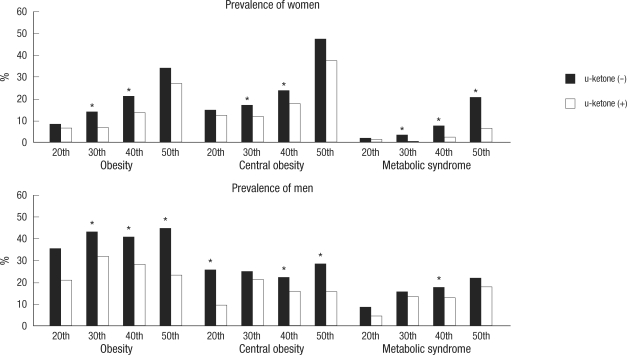
Fig. 2.
Prevalence of obesity, central obesity, and metabolic syndrome in each generation. This figure shows the prevalence of obesity, central obesity, and metabolic syndrome from the 20th to the 50th in both genders according to ketonuria under overnight fasting condition, which may represent that all subjects with ketonuria under fasting condition could be more metabolic benefit compared to the non-ketonuria.
*P<0.05 in each generation in both genders.

