Abstract
The mammalian target of rapamycin (mTOR), an evolutionarily conserved serine-threonine kinase, is an intracellular fuel sensor critical for cellular energy homeostasis. Gastrointestinal endocrine cells play a vital role in the regulation of energy balance by secreting hormones that inform the brain about energy supply. Here we showed the localization of mTOR signaling molecules in more than 90 % of gastric ghrelin cells and 36 ± 3% of gastrin cells, while no somatostatin-positive cell showed phospho-S6K1 immunoreactivity. Inhibition of mTOR significantly stimulated expression of gastric ghrelin mRNA and protein, and the concentration of plasma ghrelin (2.06±0.34 vs. 12.53±3.9 ng/ml, p<0.05), inhibited gastrin synthesis and secretion (75.01±6.71 vs. 54.04±3.65 pg/ml, p<0.05), but had no effect on somatostatin production (165.2±25.07 vs. 178.9±29.14 pg/ml, p=0.73). Gastric mTOR is a gastric sensor whose activity is linked to the differential regulation of gastric hormone production and release.
Keywords: Gastric mTOR, gastric endocrine cells, gastric hormones
1. Introduction
The mammalian target of rapamycin (mTOR) is an evolutionarily conserved serine-threonine kinase which promotes anabolic cellular processes such as protein synthesis in response to growth factors, nutrients and stress [16]. Ribosomal S6 kinase 1 (S6K1) and eukaryotic initiation factor 4E-binding protein (4EBP1) are downstream targets of mTOR [16]. Activation of mTOR leads to the phosphorylation of S6K which increases kinase activity and results in phosphorylation of ribosomal S6 polypeptide [23]. Phosphorylation of S6 selectively increases the translation of mRNA transcripts containing a tract of pyrimidine (TOP) motif. These TOP-containing mRNAs encode ribosomal proteins and other translational regulators [19].
mTOR has also been reported to serve as an intracellular ATP sensor. In vitro studies have demonstrated that cellular levels of ATP increase mTOR signaling [6]. Cota et al. have recently demonstrated that mTOR signaling in hypothalamic neurons is critical for energy balance [3]. This concept is supported by the observation that tissue-specific deletion of tuberous sclerosis complex 1, an upstream inhibitor of mTOR signaling in hypothalamic pro-opiomelanocortin (POMC) neurons, results in hyperphagic obesity. This effect can be reversed by inhibition of mTOR signaling by rapamycin [20]. We have reported that mTOR is also a gastric fuel sensor whose activity is linked to the regulation of energy intake through ghrelin expression [33]. These observations suggest that mTOR may have a role in control of nutrient intake and energy balance through both central and peripheral mechanisms.
While initiation of food intake is driven by the hypothalamus [9], anorexigenic and orexigenic peptides secreted by the endocrine cells within the gastrointestinal tract signal the hypothalamus relative to energy status [4]. Within the stomach, endocrine cells have the following relative abundances: G, ECL, D, enterochromaffin (EC), and X/A-like cells. The major neuroendocrine products have been identified as gastrin in G cells, histamine and uroguanylin in ECL cells, somatostatin in D cells, serotonin in EC cells, and ghrelin in X/A like cells [28]. Whether mTOR may serve as the fuel sensing molecule in gastric endocrine cells and mediate production of gastric hormones is unknown. The aim of this study was to examine the distribution of mTOR in gastric endocrine cells and to determine the relationship between mTOR activity and gastric hormone production. We report here that mTOR signaling molecules are expressed selectively in nearly all gastric X/A like cells, about 1/3 of G cells, but not in D cells. Inhibition of gastric mTOR signaling by rapamycin leads to increases in production of ghrelin, decreases in gastrin synthesis, while rapamycin demonstrates no effect on the production of somatostatin.
2. Materials and Methods
2.1. Ethical approval
The animals used in this study were handled in accordance with the Guide for the Care and Use of Laboratory Animals published by the US National Institutes of Health (NIH publication no. 85-23, revised 1996), and all the experimental protocols were approved by the Animal Care and Use Committee of Peking University.
2.2. Administration of drugs
Twelve week old male C57BL/6J mice were housed in standard plastic rodent cages and maintained at a regulated environment (24°C, 12:12 hour light:dark cycle with lights on at 7:00 AM). Regular chow and water were available ad libitum. C57BL/6J mice were divided into two groups: control group (n=6) in which animals were administered dimethylsulfoxide (DMSO) by intraperitoneal (ip) injection, and treatment group (n=6) in which mice received rapamycin at a dose of 1 mg/kg injection for 6 days.
2.3. Materials
Eukaryotic initiation factor (eIF)-4E (species cross-reactivity: human, mouse and rat), phospho-mTOR (Ser2448) rabbit monoclonal antibodies (species cross-reactivity: human, mouse and rat), and phospho-p70S6 (Thr389) mouse monoclonal antibody (species cross-reactivity: human, mouse and rat) were from Cell Signaling Technology (Beverly, MA). Rabbit anti-phospho-S6 (ser235, 236) (species cross-reactivity: human, mouse and rat), mouse anti-preproghrelin (species cross-reactivity: human, mouse and rat) was purchased from Abcam Inc. (Cambridge, MA). Rabbit anti-gastrin (species cross-reactivity: human, mouse and rat) was from Novus Biologicals, Inc (Littleton, CO). Chromogranin A rabbit antibody (species cross-reactivity: human, mouse and rat) was purchased from Epitomics, Inc. (Burlingame, CA). Somatostatin rabbit antibody (species cross-reactivity: human, mouse and rat), mouse anti-β-actin antibody (species cross-reactivity: human, mouse, rat, dog and monkey), goat anti-rabbit fluorescein isothiocyanate-conjugated IgG, and goat anti-mouse Texas Red-conjugated IgG and rapamycin were purchased from Santa Cruz Biotechnology, Inc. (Santa Cruz, CA). Dimethylsulfoxide was from Sigma Chemical Co. (St. Louis, MO). Ghrelin enzyme immunoassay kit, and gastrin and somatostatin radioimmunoassay kits were from Phoenix Pharmaceuticals, Inc. (Burlingame, CA). Aprotinin was purchased from Amersham Biosciences (Pittsburgh, PA). IRDye-conjugated affinity purified anti-rabbit, anti-mouse IgGs were purchased from Rockland (Gilbertsville, PA). Trizol reagent and the reverse transcription (RT) system were from Promega, Inc. (Madison, WI).
2.4. Measurement of plasma ghrelin, gastrin, and somatostatin
Blood samples were transcardially collected after anesthesia in the presence of aprotinin (2μg/ml) and EDTA (1 mg/ml). Plasma was stored at -70° before use. Total ghrelin was measured using an enzyme immunoassay kit according to the manufacturer’s instructions. Gastrin and somatostatin were measured using radioimunoassay kits according to the manufacturer’s instructions.
2.5. RNA extraction and quantitative real-time PCR analysis
Gastric total RNA was isolated using the trizol reagent. RT was performed using the RT system according to the manufacturer’s instruction. PCR was conducted in a 25μL volume containing 2.5μL cDNA, 5 mM MgCl2, 0.2 mM dNTPs, 0.2 μM each primer, 1.25 U AmpliTaq Polymerase and 1μL 800 × diluted SYBRGreen I stock using the M×3000 multiplex quantitative PCR system (Stratagene, La Jolla, CA). Primers used in this study were:
Mouse ghrelin (accession no. NM 021488) sense 5’-CCATCTGCAGTTTGCTGCTA -3’ and antisense 5’-GCAGTTTAGCTGGTGGCTTC-3’,
Mouse gastrin (accession no. NM 010257) sense 5’-GGACCAATGAGGACCTG GAAC-3’ and anti-sense 5’-CCAAAGTCCATCCATCCGTAG-3’,
Mouse somatostatin (accession no. NM 009215) sense 5’-TGAGGCAAGGAAG ATGCTGTC-3’, anti-sense 5’-GACAGCAGCTCTGCCAAGAAG-3’,
Mouse GAPDH (accession no. M32599) sense 5’-ATGACATCAAGAAGGTGGTG-3’ and antisense 5’-CATACCAGGAAATGAGCTTG-3’.
2.6. Western blot analysis
Gastric tissue was quickly harvested, rinsed thoroughly with PBS, and then homogenized on ice in lysis buffer (50 mM Tris-HCl; 15 mM EGTA; 100 mM NaCl; 0.1% Triton X-100 supplemented with protease inhibitor cocktail, pH 7.5). After centrifugation for 10 min at 4 °C, the supernatant was used for Western blot analysis. Protein concentration was measured by Bradford’s method. A total of 80 μg protein from each sample was loaded onto SDS-PAGE gels. Proteins were transferred to polyvinylidene fluoride membranes. The membranes were incubated for 1 h at room temperature with 5% fat-free milk in Tris buffered saline containing Tween-20, followed by incubation overnight at 4 °C with the individual primary antibody. Specific reaction was detected using IRDye-conjugated second antibody and visualized using the Odyssey infrared imaging system (LI-COR Biosciences, Lincoln, NE).
2.7. Double-labeling immunohistochemistry
C57BL/6J mice were deeply anesthetized using sodium pentobarbital (40mg/kg, ip), perfused transcardially with 20 ml 0.1 M PBS (pH 7.4), followed by 20 ml 4% paraformaldehyde in PBS. The whole stomach was quickly removed and opened along the greater curvature and rinsed thoroughly with PBS to remove attached debris. The tissues were post-fixed in 4% paraformaldehyde, dehydrated, embedded in wax, and sectioned at 6 μm. Paraffin-embedded sections were dewaxed, rehydrated, and rinsed in PBS. After boiling for 10 min in 0.01 mol/L sodium citrate buffer (pH 6.0), sections were blocked in 5% goat serum in PBS for 1 h at room temperature. Primary antibodies used were rabbit anti-phospho-mTOR (Ser2448) antibody (1:50), mouse anti-phospho-p70S6 (1:50), rabbit anti-phospho-S6 (ser235, Ser236) (1:100), chromogranin A rabbit antibody (1:100), mouse anti-preproghrelin (3μg/ml), rabbit anti-gastrin (1:200), and rabbit anti-somatostatin (1:100). Slides were incubated with primary antibody overnight at 4°C, then washed in 1X PBS/0.1% Tween-20 three times for 5 minutes each. Secondary antibodies used included goat anti rabbit fluorescein isothiocyanate-conjugated IgG (1:100) and goat anti-mouse Texas Red-conjugated IgG (1:100). Gastric tissues were incubated with secondary antibody for 2 hours at room temperature. Controls included substituting primary antibodies with relevant IgGs. Fluorescent signals were observed and photomicrographs taken under a confocal laser-scanning microscope (Leica, Germany).
2.8. Statistical analysis
All values are expressed as mean ±SEM. Statistical differences were evaluated by two-way ANOVA and Newman-Student-Keuls test. Comparisons between two groups involved use of the Student’s t test. P value < 0.05 denotes statistical significance.
3. Results
3.1. Localization of mTOR signaling molecules in gastric mucosa
To determine whether mTOR signaling molecules are expressed in gastric mucosa, immunofluorescent staining was used to localize phospho-mTOR (Ser2448) and its downstream targets, phospho-S6K1 (Thr389) and phospho-S6 (ser235,236), in mouse gastric mucosa. Antibodies recognizing phospho-mTOR (Ser2448), phospho-S6K1 (Thr389) and phospho-S6 (ser235, 236) demonstrated strong positive reactivity in cells located in the basal one third of the gastric mucosa (Figure 1).
Figure 1. Localization of mTOR signaling molecules in mouse gastric mucosa.
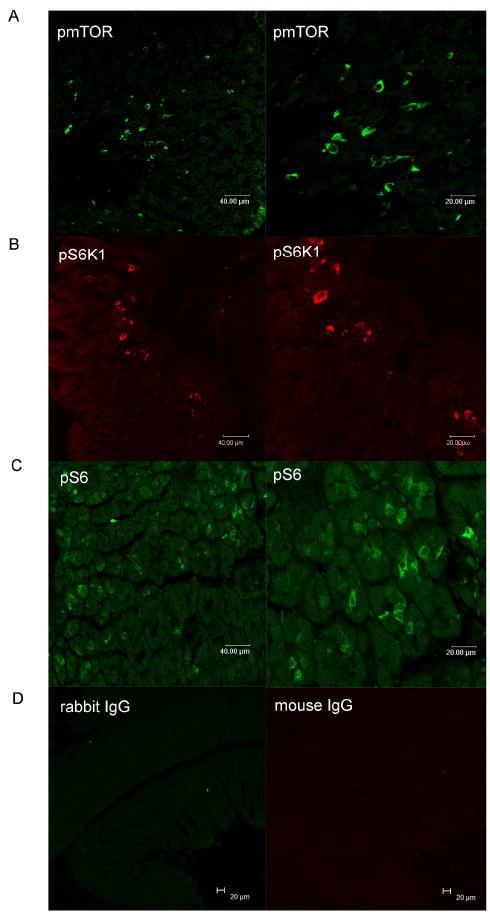
Green, pmTOR (panel A) and pS6 (panel C); red, pS6K (panel B). Controls included substituting primary antibodies with mouse IgG or rabbit IgG (panel D).
3.2. Co-localization of mTOR signaling molecules in gastric neuroendocrine cells
To investigate whether mTOR signaling is present within endocrine cells of the stomach, we performed dual-labeled immunofluorescent analyses to detect the co-localization of phospho-mTOR, phospho-S6K1 or phospho-S6 with various markers of endocrine cells. In gastric fundus, 31± 4% of chromogranin A-immunoreactive cells also expressed phospho-S6K1, the down-stream target of mTOR, while 76±10% phospho-S6K1-immunoreactive cells expressed chromogranin A (Figure 2).
Figure 2. Co-localization of pS6K1 with chromogranin A.
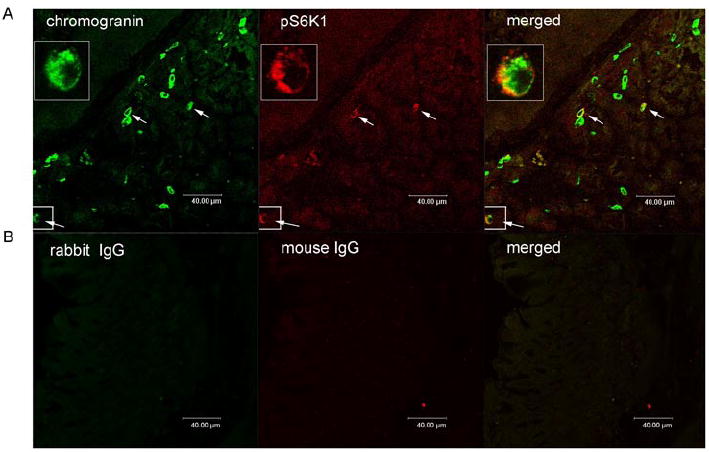
Images depicting chromogranin A (green) and phosphoS6K1 (pS6K1) (red) in gastric mucosal cells. Merged image illustrates co-localization of phosphoS6K1 and chromogranin A (orange) (panel A). Controls included substituting primary antibodies with mouse IgG and rabbit IgG (panel B). Cells expressing both pS6K1 and chromogranin A were marked with white arrows.
As shown in Figure 3, 36 ± 3 % of gastrin-immunoreactive cells expressed phospho-S6K1, while 12± 5 % of phospho-S6K1 containing gastric mucosal cells co-expressed gastrin.
Figure 3. Co-localization of pS6K1 with gastrin.
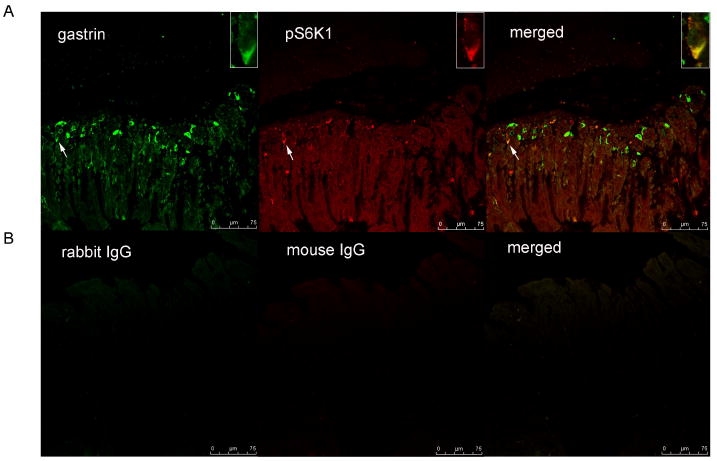
Immunofluorescent staining for gastrin (green) and phosphoS6K1 (pS6K1) (red) in gastric mucosal cells. Merged image illustrates co-localization of pS6K1 and gastrin (orange) (panel A). Controls included substituting primary antibodies with mouse IgG and rabbit IgG (panel B). Cells expressing both pS6K1 and gastrin were marked with white arrows.
As illustrated in Figure 4, 95% of ghrelin-positive cells stained positively for phospho-mTOR. Similarly, 92 ± 1 % of ghrelin-immunoreactive gastric cells expressed phospho-S6, while 26 ± 1 % of phospho-S6 containing gastric mucosal cells were positive for ghrelin immunoreactivity (Figure 4).
Figure 4. Co-localization of mTOR signaling molecules with ghrelin.
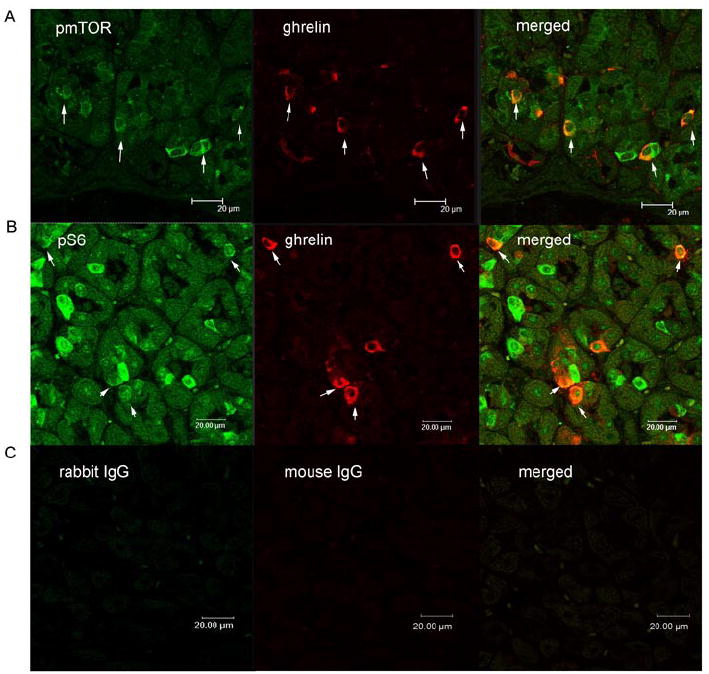
Immunofluorescent staining for phospho-mTOR (pmTOR) (green) and ghrelin (red) in gastric mucosal cells. Merged image illustrates co-localization of pmTOR and ghrelin (orange) (panel A). Immunofluorescent staining for phospho-S6 (pS6) (green) and ghrelin (red) in gastric mucosal cells. Merged image illustrates co-localization of pmTOR and ghrelin (orange) (panel B). Controls included substituting primary antibodies with mouse IgG and rabbit IgG (panel C). White arrows indicate the co-localization of ghrelin and pmTOR or pS6.
No co-localization of somatostatin immnuoreactivity with phospho-S6K1 was observed in gastric epithelium (Figure 5).
Figure 5. Co-localization of mTOR signaling molecules with somatostatin.
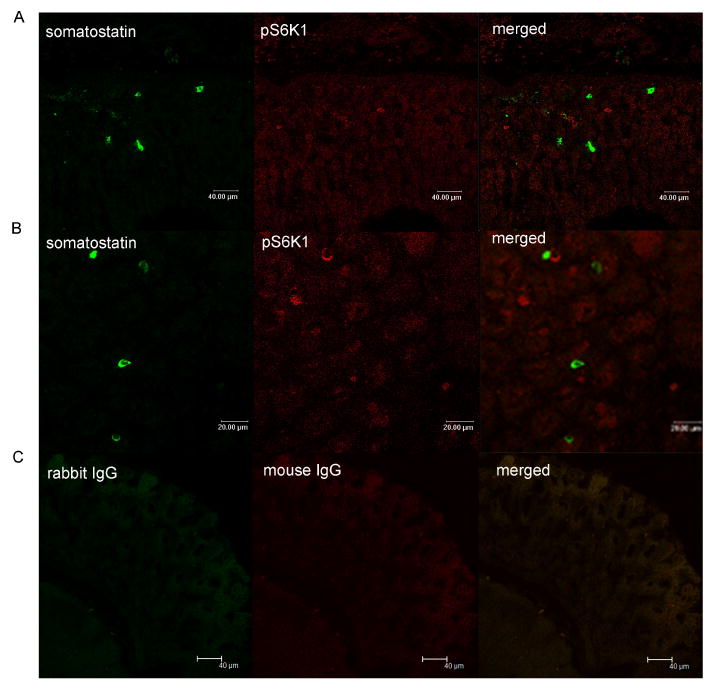
Images depict immunofluorescent staining for somatostatin (green) and phosphor-S6K1 (pS6K1) (red) in gastric mucosal cells. Merged image illustrates co-localization of pS6K1 and somatostatin (panel A and B). Controls included substituting primary antibodies with mouse IgG and rabbit IgG (panel C).
3.3. Effect of rapamycin on gastrin
The effects of rapamycin, a well-characterized mTOR inhibitor, were examined in C57BL/6J mice. Twelve week old male C57BL/6J mice were divided into two groups: control dimethylsulfoxide (DMSO) intraperitoneal (ip) injection or rapamycin (1 mg/kg) injection ip for 6 days. As shown in Figure 6, intraperitoneal injection of rapamycin significantly decreased gastric phospho-S6 (Ser235/236) expression, a marker of mTOR activity (Figure 6A). The decrease in gastric mTOR signaling in mice treated with rapamycin was associated with a significant decrease in gastric gastrin mRNA (Figure 6B), gastric gastrin protein levels (Figure 6A), and circulating gastrin (Figure 6C) compared with control mice.
Figure 6. Regulation of gastrin by rapamycin.
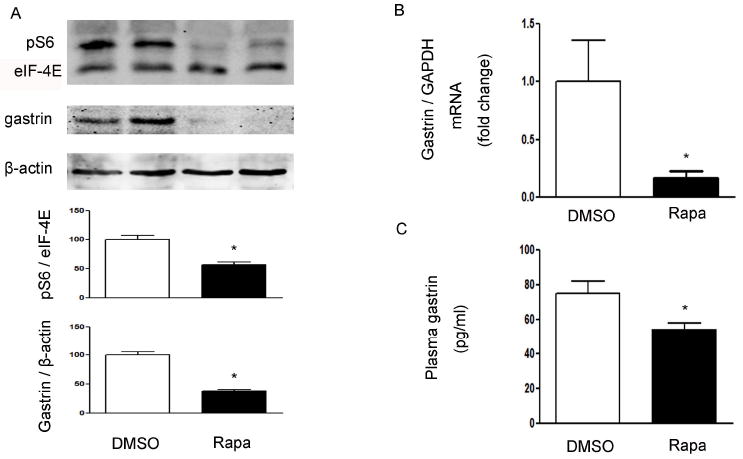
(A) Western blot from mice that received ip injection of DMSO or rapamycin (Rapa 1 mg/kg). Phospho-S6 (pS6), eIF-4E, gastrin and β-actin in gastric mucosa were detected using specific antibodies. β-actin and eIF-4E were used as loading controls. Quantification of image analysis of gastric pS6 and gastrin is expressed as mean ±SEM. (B) Results of quantitative PCR analysis of gastrin is expressed as fold change from control using glyceraldehyde 3-phosphate dehydrogenase (GAPDH) as loading control. (C) Plasma gastrin was expressed as mean ±SEM. Six animals were examined for each condition. *, P <0.05 vs. mice receiving DMSO.
3.4. Regulation of ghrelin by rapamycin
The decrease in gastric mTOR signaling in mice treated with rapamycin was associated with a significant increase in gastric ghrelin mRNA (Figure 7B), gastric preproghrelin levels (Figure 7A), and circulating ghrelin (Figure 7C) compared with control mice.
Figure 7. Modulation of ghrelin by rapamycin.

(A) Ghrelin and β-actin in gastric mucosa were detected using specific antibodies. β-actin was used as loading controls. Quantification of image analysis of preproghrelin is expressed as mean ±SEM. (B) Results of quantitative PCR analysis of ghrelin are expressed as fold increase from control using glyceraldehyde 3-phosphate dehydrogenase (GAPDH) as loading control. (C) Plasma ghrelin expressed as mean ±SEM. Six samples were examined for each condition. *, P <0.05 vs. mice receiving DMSO.
3.5. Effect of rapamycin on somatostatin
In contrast to the changes in ghrelin and gastrin, intraperitoneal injection of rapamycin demonstrated no effect on somatostatin expression for tissue somatostatin mRNA (Figure 8B) and protein levels (Figure 8A) and in circulating somatostatin (Figure 8C), despite of the inhibition of gastric mTOR signaling by rapamycin (Figure 6A).
Figure 8. Regulation of somatostatin by rapamycin.

(A) Somatostatin and β-actin in gastric mucosa were detected using specific antibodies. β-actin was used as loading controls. Quantification of image analysis of gastric somatostatin is expressed as mean ±SEM. (B) Results of quantitative PCR analysis of somatostatin is expressed as fold change from control using glyceraldehyde 3-phosphate dehydrogenase (GAPDH) as loading control. (C) Plasma somatostatin was expressed as mean ±SEM. Six samples were examined for each condition. *, P <0.05 vs. mice receiving DMSO.
4. Discussion
The major finding of the current study is that mTOR signaling is present in gastric endocrine cells and that its inhibition alters the expression of ghrelin and gastrin. This conclusion is supported by the following distinct observations: 1) the mTOR signaling molecules, phospho-mTOR, phospho-S6K1 and phospho-S6, are expressed in gastric mucosa; 2) a subpopulation of gastric mucosal cells that express the neuroendocrine marker chromogranin A also express mTOR pathway molecules; 3) nearly all ghrelin-positive cells stained positively for phospho-mTOR and 1/3 of gastrin-immunoreactive gastric cells expressed phospho-S6K1, while somatostatin-immunoreactive gastric cells do not; 4) rapamycin stimulates ghrelin production, inhibits gastrin synthesis, but demonstrates no effect on the synthesis and secretion of somatostatin.
Ghrelin, a 28-amino-acid gastric peptide, is the only currently identified circulating hormone that is able to induce the sensation of hunger and to initiate food intake [32]. The stomach is the predominant site of the production of ghrelin, although low-level expression of ghrelin has been detected in a wide variety of tissues [34]. Ghrelin secretion patterns are related to periods of fasting and feeding, and ghrelin levels are inversely correlated with energy supply [15]. During fasting, ghrelin secretion increases [5]. Conversely, plasma ghrelin concentrations are decreased in models of obesity [10, 11, 25, 27]. The mechanism by which organismal energy level influences the synthesis and secretion of ghrelin is the subject of intense scrutiny. Most investigations relate to mechanisms involving the central nervous system [15]. A recent study by Cota et al suggests that mTOR signaling molecules in hypothalamic neurons serve as a fuel sensor to modulate energy level and to coordinate energy availability via appetite and feeding behavior [3]. Together with previous observations that hypothalamic neurons regulate a variety of orexigenic and anorexigenic peptides, it is proposed that hypothalamic mTOR signaling provides a central mechanism for control of caloric intake [2]. Our study extends this model to involve mTOR signaling pathway in gastric endocrine cells. These studies demonstrate that direct control of ghrelin expression and secretion can occur at the level of gastric mucosa and that the mTOR signaling pathway is a crucial control point in ghrelin expression and secretion.
Gastrin is an important hormone regulating gastric acid secretion and is produced by endocrine G cells present in the antropyloric region of the stomach [7]. Gastrin release is stimulated by vagal impulses during the cephalic phase and by intramural neural reflexes as well as by the presence of food constituents in the gastric lumen during the gastric phase of acid secretion [26]. Increased production of hydrochloric acid lowers intragastric pH and inhibits further secretion of gastrin [17, 30]. The observation that rapamycin significantly inhibits gastric gastrin production and secretion in normal mice suggests that mTOR signaling may be involved in the regulation of gastrin synthesis and secretion in a proportion of gastric G cells. Notably, only 1/3 of gastrin cells contain mTOR signaling molecules, suggesting that regulation of gastrin synthesis and secretion may involve multiple mechanisms.
Somatostatin was originally isolated as a hypothalamic somatotropin-release inhibiting factor [18] and was soon found to exert powerful inhibitory effects on the secretion of multiple hormones, including gastrin [24]. In this study, we detected no mTOR activity in somatostatin cells. Furthermore, inhibition of gastric mTOR signaling by rapamycin demonstrated no effect on the synthesis and secretion of somatostatin, while other gastric hormones such as ghrelin and gastrin are altered by such treatment. This observation suggests that mTOR signaling selectively regulates the production of gastric hormones.
Chromogranin A is a widely recognized marker of neuroendocrine cells, including those of the stomach, large and small intestine, adrenal medulla and pancreatic islets [31]. Chromogranin A is also an excellent marker for carcinoid tumors, phenochromocytomas, paragangliomas, and other neuroendocrine tumors [1, 8, 22]. Co-expression of chromogranin A and neuron specific enolase is common in neuroendocrine neoplasms [21]. Detection of phospho-S6K1 in only one third of chromogranin A-immunoreactive gastric cells suggests mTOR signaling may selectively influence the function of a subpopulation of gastric endocrine cells.
Aberrant mTOR activity has been linked to the development of cancer, diabetes, and obesity [12, 13]. Significant elevation of mTOR signaling has been observed in liver and skeletal muscle of insulin-resistant obese rats maintained on a high-fat diet [14]. In contrast, absence of the mTOR downstream target ribosomal protein S6 (S6) kinase 1 protects against diet induced obesity and improves insulin sensitivity in mice [29]. These studies suggest that mTOR signaling is critical for the regulation of energy metabolism. Our study provides further evidence supporting the concept that mTOR signaling may be involved in the modulation of energy metabolism by selectively regulating the production of gastric hormones.
In summary, our study demonstrates differential expression of mTOR activity in a proportion of gastric endocrine cells. Gastric mTOR signaling selectively affects the production of ghrelin and gastrin. These observations suggest the existence of a fuel-sensing pathway within the gastric endocrine cells.
Research highlights.
the mTOR signaling molecules, phospho-mTOR, phospho-S6K1 and phospho-S6, are expressed in gastric mucosa;
a subpopulation of gastric mucosal cells that express the neuroendocrine markers chromogranin A also express mTOR pathway molecules;
nearly all ghrelin-positive cells stained positively for phospho-mTOR and 1/3 of gastrin-immunoreactive gastric cells expressed phospho-S6K1, while somatostatin-immunoreactive gastric cells do not;
rapamycin stimulates ghrelin production, inhibits gastrin synthesis, but demonstrates no effect on the synthesis and secretion of somatostatin.
Acknowledgments
This work was supported by grants from the National Natural Science Foundation of China (30890043, 30971434, 30871194, 30821001, 30700376 and 30971085), the Major National Basic Research Program of P. R. China (No. 2010CB912504), the ‘985’ Program at Peking University (985-2-097-121), and National Institute of Health grant RO1DK043225.
Abbreviations
- GI
gastrointestinal tract
- mTOR
mammalian target of rapamycin
- Rapa
rapamycin
- S6
ribosomal protein S6
Footnotes
Disclosure Summary: The authors have nothing to disclose.
Publisher's Disclaimer: This is a PDF file of an unedited manuscript that has been accepted for publication. As a service to our customers we are providing this early version of the manuscript. The manuscript will undergo copyediting, typesetting, and review of the resulting proof before it is published in its final citable form. Please note that during the production process errors may be discovered which could affect the content, and all legal disclaimers that apply to the journal pertain.
References
- 1.Bajetta E, Ferrari L, Martinetti A, Celio L, Procopio G, Artale S, et al. Chromogranin A, neuron specific enolase, carcinoembryonic antigen, and hydroxyindole acetic acid evaluation in patients with neuroendocrine tumors. Cancer. 1999;86:858–65. doi: 10.1002/(sici)1097-0142(19990901)86:5<858::aid-cncr23>3.0.co;2-8. [DOI] [PubMed] [Google Scholar]
- 2.Cota D, Proulx K, Seeley RJ. The role of CNS fuel sensing in energy and glucose regulation. Gastroenterology. 2007;132:2158–68. doi: 10.1053/j.gastro.2007.03.049. [DOI] [PubMed] [Google Scholar]
- 3.Cota D, Proulx K, Smith KA, Kozma SC, Thomas G, Woods SC, et al. Hypothalamic mTOR signaling regulates food intake. Science. 2006;312:927–30. doi: 10.1126/science.1124147. [DOI] [PubMed] [Google Scholar]
- 4.Cummings DE, Overduin J. Gastrointestinal regulation of food intake. J Clin Invest. 2007;117:13–23. doi: 10.1172/JCI30227. [DOI] [PMC free article] [PubMed] [Google Scholar]
- 5.Cummings DE, Purnell JQ, Frayo RS, Schmidova K, Wisse BE, Weigle DS. A preprandial rise in plasma ghrelin levels suggests a role in meal initiation in humans. Diabetes. 2001;50:1714–9. doi: 10.2337/diabetes.50.8.1714. [DOI] [PubMed] [Google Scholar]
- 6.Dennis PB, Jaeschke A, Saitoh M, Fowler B, Kozma SC, Thomas G. Mammalian TOR: a homeostatic ATP sensor. Science. 2001;294:1102–5. doi: 10.1126/science.1063518. [DOI] [PubMed] [Google Scholar]
- 7.Edkins JS. The chemical mechanism of gastric secretion. J Physiol. 1906;34:133–44. doi: 10.1113/jphysiol.1906.sp001146. [DOI] [PMC free article] [PubMed] [Google Scholar]
- 8.Giovanella L, La Rosa S, Ceriani L, Uccella S, Erba P, Garancini S. Chromogranin-A as a serum marker for neuroendocrine tumors: comparison with neuron-specific enolase and correlation with immunohistochemical findings. Int J Biol Markers. 1999;14:160–6. doi: 10.1177/172460089901400307. [DOI] [PubMed] [Google Scholar]
- 9.Grossman SP. Role of the hypothalamus in the regulation of food and water intake. Psychol Rev. 1975;82:200–24. [PubMed] [Google Scholar]
- 10.Hansen TK, Dall R, Hosoda H, Kojima M, Kangawa K, Christiansen JS, et al. Weight loss increases circulating levels of ghrelin in human obesity. Clin Endocrinol. 2002;56:203–6. doi: 10.1046/j.0300-0664.2001.01456.x. [DOI] [PubMed] [Google Scholar]
- 11.Haqq AM, Farooqi IS, O’Rahilly S, Stadler DD, Rosenfeld RG, Pratt KL, et al. Serum ghrelin levels are inversely correlated with body mass index, age, and insulin concentrations in normal children and are markedly increased in Prader-Willi syndrome. J Clin Endocrinol Metab. 2003;88:174–8. doi: 10.1210/jc.2002-021052. [DOI] [PubMed] [Google Scholar]
- 12.Inoki K. Role of TSC-mTOR pathway in diabetic nephropathy. Diabetes Res Clin Pract. 2008;82(Suppl 1):S59–62. doi: 10.1016/j.diabres.2008.09.028. [DOI] [PubMed] [Google Scholar]
- 13.Inoki K, Corradetti MN, Guan KL. Dysregulation of the TSC-mTOR pathway in human disease. Nat Genet. 2005;37:19–24. doi: 10.1038/ng1494. [DOI] [PubMed] [Google Scholar]
- 14.Khamzina L, Veilleux A, Bergeron S, Marette A. Increased activation of the mammalian target of rapamycin pathway in liver and skeletal muscle of obese rats: possible involvement in obesity-linked insulin resistance. Endocrinology. 2005;146:1473–81. doi: 10.1210/en.2004-0921. [DOI] [PubMed] [Google Scholar]
- 15.Kojima M, Kangawa K. Ghrelin: structure and function. Physiol Rev. 2005;85:495–522. doi: 10.1152/physrev.00012.2004. [DOI] [PubMed] [Google Scholar]
- 16.Laplante M, Sabatini DM. mTOR signaling at a glance. J Cell Sci. 2009;122:3589–94. doi: 10.1242/jcs.051011. [DOI] [PMC free article] [PubMed] [Google Scholar]
- 17.Larsson LI. Developmental biology of gastrin and somatostatin cells in the antropyloric mucosa of the stomach. Microsc Res Tech. 2000;48:272–81. doi: 10.1002/(SICI)1097-0029(20000301)48:5<272::AID-JEMT4>3.0.CO;2-N. [DOI] [PubMed] [Google Scholar]
- 18.Ling N, Burgus R, Rivier J, Vale W, Brazeau P. The use of mass spectrometry in deducing the sequence of somatostatin-a hypothalamic polypeptide that inhibits the secretion of growth hormone. Biochem Biophys Res Commun. 1973;50:127–33. doi: 10.1016/0006-291x(73)91073-5. [DOI] [PubMed] [Google Scholar]
- 19.Meyuhas O. Synthesis of the translational apparatus is regulated at the translational level. Eur J Biochem. 2000;267:6321–30. doi: 10.1046/j.1432-1327.2000.01719.x. [DOI] [PubMed] [Google Scholar]
- 20.Mori H, Inoki K, Munzberg H, Opland D, Faouzi M, Villanueva EC, et al. Critical role for hypothalamic mTOR activity in energy balance. Cell Metab. 2009;9:362–74. doi: 10.1016/j.cmet.2009.03.005. [DOI] [PMC free article] [PubMed] [Google Scholar]
- 21.O’Connor DT, Deftos LJ. Secretion of chromogranin A by peptide-producing endocrine neoplasms. N Engl J Med. 1986;314:1145–51. doi: 10.1056/NEJM198605013141803. [DOI] [PubMed] [Google Scholar]
- 22.Portel-Gomes GM, Grimelius L, Johansson H, Wilander E, Stridsberg M. Chromogranin A in human neuroendocrine tumors: an immunohistochemical study with region-specific antibodies. Am J Surg Pathol. 2001;25:1261–7. doi: 10.1097/00000478-200110000-00006. [DOI] [PubMed] [Google Scholar]
- 23.Proud CG. Regulation of mammalian translation factors by nutrients. Eur J Biochem. 2002;269:5338–49. doi: 10.1046/j.1432-1033.2002.03292.x. [DOI] [PubMed] [Google Scholar]
- 24.Raptis S, Dollinger HC, von Berger L, Schlegel W, Schroder KE, Pfeiffer EF. Effects of somatostatin on gastric secretion and gastrin release in man. Digestion. 1975;13:15–26. doi: 10.1159/000197691. [DOI] [PubMed] [Google Scholar]
- 25.Rosicka M, Krsek M, Matoulek M, Jarkovska Z, Marek J, Justova V, et al. Serum ghrelin levels in obese patients: the relationship to serum leptin levels and soluble leptin receptors levels. Physiol Res. 2003;52:61–6. [PubMed] [Google Scholar]
- 26.Sachs G, Zeng N, Prinz C. Physiology of isolated gastric endocrine cells. Annu Rev Physiol. 1997;59:243–56. doi: 10.1146/annurev.physiol.59.1.243. [DOI] [PubMed] [Google Scholar]
- 27.Shiiya T, Nakazato M, Mizuta M, Date Y, Mondal MS, Tanaka M, et al. Plasma ghrelin levels in lean and obese humans and the effect of glucose on ghrelin secretion. J Clin Endocrinol Metab. 2002;87:240–4. doi: 10.1210/jcem.87.1.8129. [DOI] [PubMed] [Google Scholar]
- 28.Solcia E, Rindi G, Buffa R, Fiocca R, Capella C. Gastric endocrine cells: types, function and growth. Regul Pept. 2000;93:31–5. doi: 10.1016/s0167-0115(00)00175-0. [DOI] [PubMed] [Google Scholar]
- 29.Um SH, Frigerio F, Watanabe M, Picard F, Joaquin M, Sticker M, et al. Absence of S6K1 protects against age- and diet-induced obesity while enhancing insulin sensitivity. Nature. 2004;431:200–5. doi: 10.1038/nature02866. [DOI] [PubMed] [Google Scholar]
- 30.Uvnas-Wallenstein K, Uvnas B, Nilsson G. Quantitative aspects of the vagal control of gastrin release in cats. Acta Physiol Scand. 1976;96:19–28. doi: 10.1111/j.1748-1716.1976.tb10167.x. [DOI] [PubMed] [Google Scholar]
- 31.Wilson BS, Lloyd RV. Detection of chromogranin in neuroendocrine cells with a monoclonal antibody. Am J Pathol. 1984;115:458–68. [PMC free article] [PubMed] [Google Scholar]
- 32.Woods SC. Gastrointestinal satiety signals I. An overview of gastrointestinal signals that influence food intake. Am J Physiol Gastrointest Liver Physiol. 2004;286:G7–13. doi: 10.1152/ajpgi.00448.2003. [DOI] [PubMed] [Google Scholar]
- 33.Xu G, Li Y, An W, Li S, Guan Y, Wang N, et al. Gastric mammalian target of rapamycin signaling regulates ghrelin production and food intake. Endocrinology. 2009;150:3637–44. doi: 10.1210/en.2009-0372. [DOI] [PMC free article] [PubMed] [Google Scholar]
- 34.Xu G, Li Y, An W, Zhang W. Ghrelin and cell differentiation. Acta Biochim Biophys Sin. 2008;40:841–7. [PubMed] [Google Scholar]


