
Figure 8. Regulation of somatostatin by rapamycin.
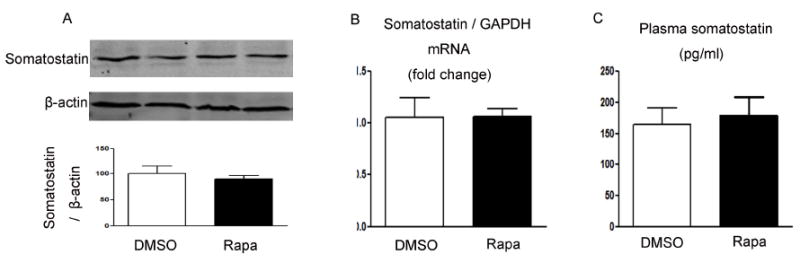
(A) Somatostatin and β-actin in gastric mucosa were detected using specific antibodies. β-actin was used as loading controls. Quantification of image analysis of gastric somatostatin is expressed as mean ±SEM. (B) Results of quantitative PCR analysis of somatostatin is expressed as fold change from control using glyceraldehyde 3-phosphate dehydrogenase (GAPDH) as loading control. (C) Plasma somatostatin was expressed as mean ±SEM. Six samples were examined for each condition. *, P <0.05 vs. mice receiving DMSO.