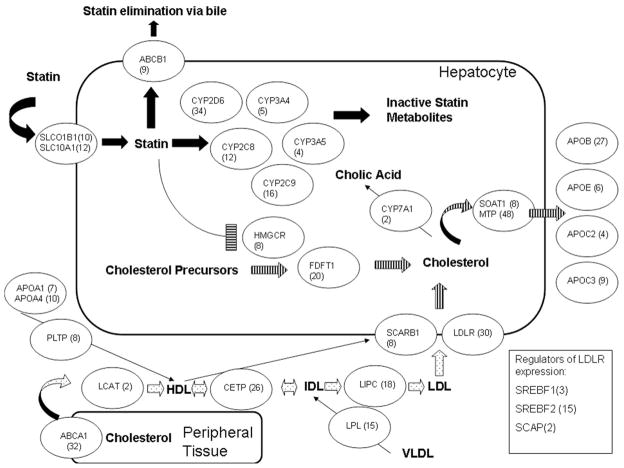
Figure 2.
Candidate pathways and genes. The 4 different pathways are depicted here: (1) statin pharmacokinetics (solid), (2) statin pharmacodynamics (horizontal stripe), (3) cholesterol metabolism (vertical stripe), and (4) lipoprotein metabolism (dotted). Each of the candidate genes is depicted in ovals with the number of SNPs per gene in parentheses. Not depicted are APOA2 (12) and LRP2 (62).

