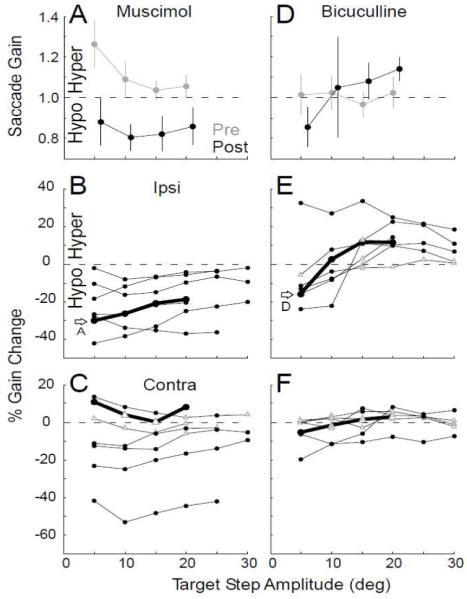
Figure 2.

Effect of representative muscimol (A,B,C) and bicuculline (D,E,F) injections on saccades to different target step sizes. (A,D) Mean pre- (gray) and post-injection (black) ipsiversive saccade gain at different target step sizes for an exemplar experiment. Error bar: standard deviation. (B,C,E,F) Percent gain change of ipsiversive (B,E) and contraversive (C,F) saccades for all injections. The thick black line and open arrow identify the data in A, D, respectively. Filled circles: significant percent gain changes (p<0.05); open triangles: those that are not (p>0.05).
