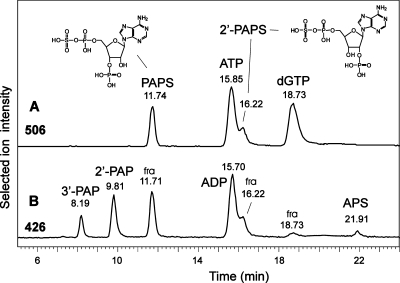
Figure 3.
Analytes isobaric to ATP. The traces in panels A and B show the result obtained with a tobacco extract spiked with PAPS and 2′-PAPS. Panel A is the SIC for ATP (505.96−506.02 amu) accompanied by dGTP and the almost isobaric PAPS isomers. Panel B depicts the SIC for ADP (425.98-426.94) with unintended MS fragments (labeled “fra”) of PAPS, 2′-PAPS, and to a lesser degree dGTP. In addition, degradation products present in the PAPS and 2′-PAPS standards tentatively identify the elution position of 3′-phosphoadenosine-5′-phosphate (3′-PAP) and 2′-PAP as well as adenosine-5′-phosphosulfate (APS).

