Figure 5.
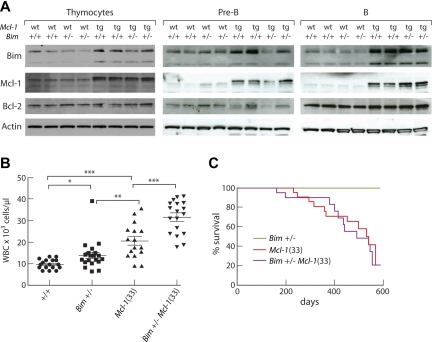
Bim restrains the impact of Mcl-1 overexpression on hematopoietic homeostasis. (A) Western blot analysis of Bim expression in thymocytes, pre-B cells (B220+ IgM− IgD− CD43− BM cells), and B cells (B220+ LN cells) from 6- to 8-week-old WT, Bim+/−, Mcl-1(33), and Bim+/− Mcl-1(33) mice; each lane represents an individual mouse and results are typical of 2 experiments. (B) Peripheral white blood cell counts of 4-week-old mice. Points represent individual mice. Bars represent mean ± SEM. *P < .05, **P < .01, ***P < .001 (Student t test). (C) Kaplan-Meier survival curve of tumor-related deaths in cohorts of Bim+/− mice (olive, n = 8); Mcl-1(33) mice (red, n = 23), median survival, 531 days; and Bim+/− Mcl-1(33) mice (magenta n = 20), median survival, 491 days.

