Figure 7.
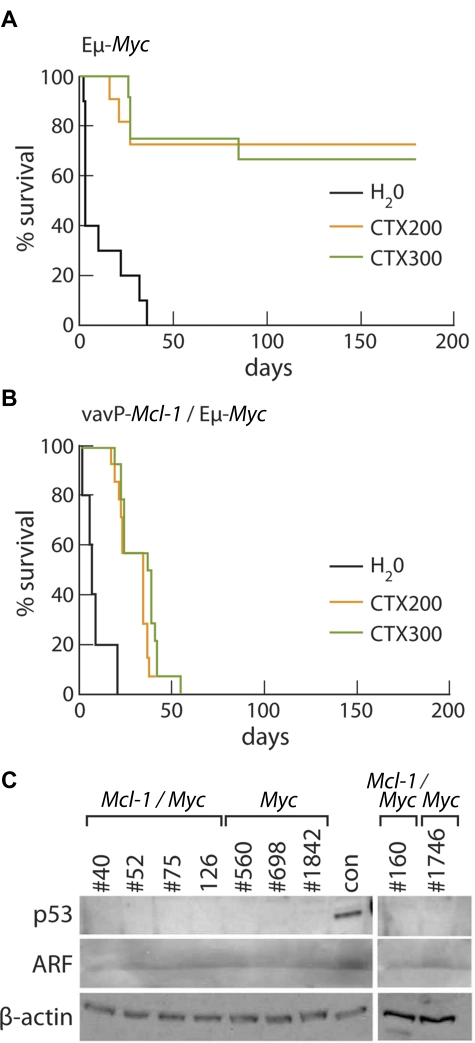
Mcl-1 confers resistance to cyclophosphamide therapy in vivo. (A) Kaplan-Meier survival curves of Eμ-Myc tumor-bearing mice treated with water (black, n = 10), median survival, 3 days; 200 mg/kg cyclophosphamide (orange, n = 11); or 300 mg/kg cyclophosphamide (green, n = 12). Data from 4 independent Eμ-Myc tumors (1 pre-B, #1746 and 3 B-cell tumors, #698, #560, and #1842), each of which was transplanted into a total of 7 of 10 recipients. (B) Kaplan-Meier survival curves of Mcl-1(33)/Eμ-Myc tumor-bearing mice treated with water (black, n = 10), median survival, 7 days; 200 mg/kg cyclophosphamide (orange, n = 14), median survival, 35 days; and 300 mg/kg cyclophosphamide (green, n = 14), median survival, 38 days. Data from 5 independent Mcl-1/Eμ-Myc tumors (1 pre-B cell, #160 and 4 B-cell tumors, #40, #52, #75, and #126), each of which was transplanted into a total of 8 recipients. The median survival of treated Mcl-1/Myc tumor-bearing mice was significantly less than that of treated Myc tumor-bearing mice: P = .001 at 200 mg/kg; P = .0002 at 300 mg/kg. (C) Western blot analysis showed that, unlike the control tumor (con) having a mutation affecting the p53-ARF pathway, none of the Mcl-1/Myc or Myc tumors used in treatment studies shown in panels A and B overexpresses p53 or ARF protein.

