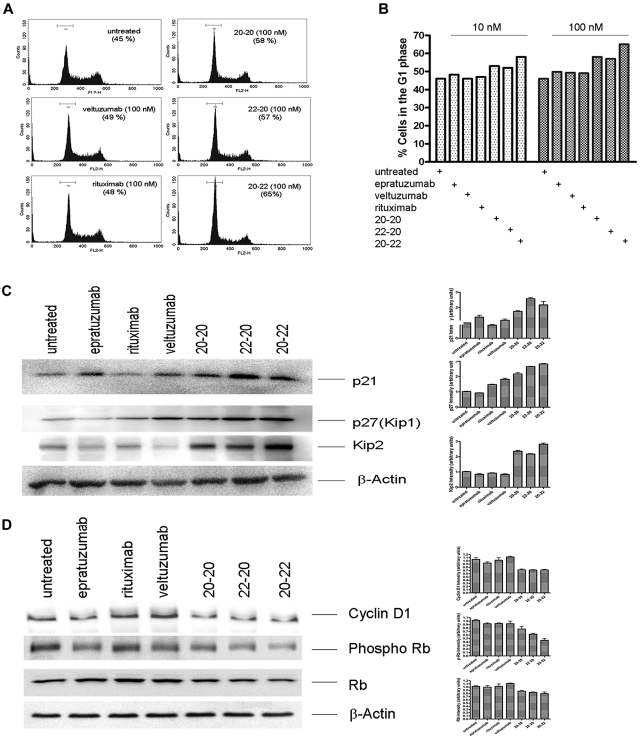
Figure 6.
Deregulation of cell cycle. (A) Histograms obtained from Daudi cells treated with 100nM of each agent, showing G1 arrest induced by 20-20, 22-20, and 20-22. (B) Comparison of cells in the G1 phase after treatment with each agent at 10 or 100nM. (C) Up-regulation of the Cip/Kip family of proteins on treatment with 20-20, 20-22, and 22-20. (D) Down-regulation of cyclin D1 and p-Rb.

