Figure 3.
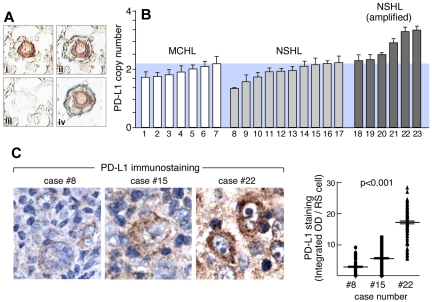
PD-1 ligand amplification and overexpression in primary HL. (A) Laser-capture microdissection (LCM) of primary HL Reed-Sternberg RS cells. (Ai) RS cells were identified by CD30 staining, (Aii) selected by laser (Arcturus PixCell II), (Aiii) removed from surrounding nonneoplastic tissue, resulting in (Aiv) highly enriched RS cell specimens. (B) qPCR-based DNA copy number analysis of PD-L1 in LCM primary RS cells isolated from 7 MCHLs and 16 NSHLs. Data are means (± SD) of triplicate qPCR reactions performed on pooled DNA samples from RS cells or normal tissue from each slide, repeated for 3 slides per sample. (C left) Quantitative IHC of PD-L1 in 3 representative cases (8, 15, and 22) from panel B. (C right) Quantitative analysis of PD-L1 immunostaining in 150 individual RS cells from each of these cases (8, 15, and 22).

