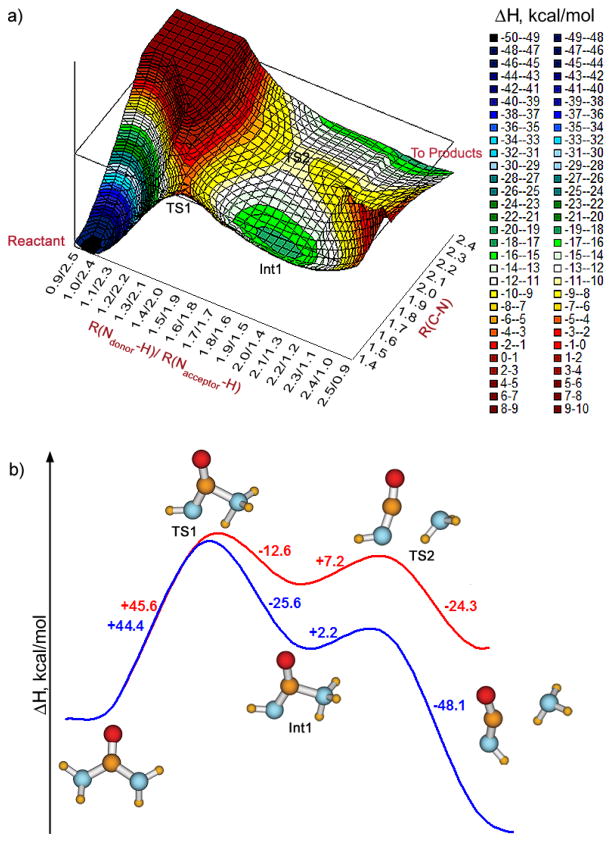
Figure 1.
(a) Projection of the gas phase PDDG PES for the unimolecular elimination of ammonia on the two reaction-coordinates, the difference of the two N-H distances, and R(C-N). (b) PDDG reaction profile for urea decomposition via elimination of ammonia in the gas phase (red curve) and including GB/SA hydration (blue curve).

