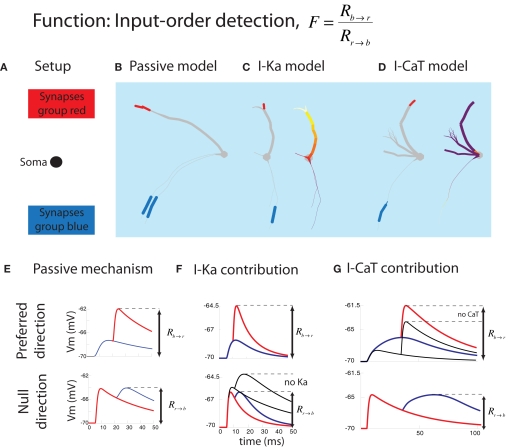
Figure 4.
Summary of the result in the input-order detection function. (A) Experimental setup. The location of the soma and synapses are fixed. (B) Typical passive model optimized for Δt = 20 ms and having one thick branch and one (or here two) thin branch. The blue and red bars correspond to the colors from (A). (C) Typical model containing IKA optimized for short Δt = 10 ms (illustrating both the synapses and the IKA distribution). The density of the voltage-gated channel is heat-color coded; white represents the maximum allowed density while purple means 0. IKA channels were always densely located in the thick branch while no IKA channels were inserted in the thin branch. (D) Typical model containing ICaT optimized for long Δt = 25 ms. An ICaT hotspot was always found close to the blue synapses. (E) Two electrophysiological mechanisms underlying successful input-order detection. In the preferred direction, the second EPSP (red) should arrive at the soma at the peak of the first (blue) EPSP. In null-direction, the second EPSP (blue) should arrive at the soma when the first EPSP (red) is decayed as much as possible. (F) Contribution of IKA to short Δt. It promotes faster decay of the first (red) EPSP in the null-direction. (G) Contribution of ICaT to long Δt. ICaT boosts the first (blue) EPSP in the preferred direction (figures are modified from Torben-Nielsen and Stiefel, 2009).

