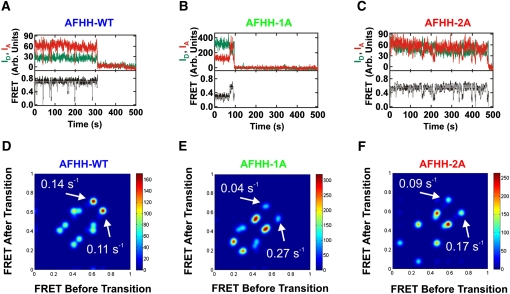
FIGURE 5.
Single molecule FRET analysis. (A–C) Exemplary single molecule time traces showing donor (green) and acceptor (red) intensities, and the corresponding FRET ratio (black) with HaMMy fit (gray). Conditions are, 50 mM Tris-HCl (pH 8.0), 10 mM Mg2+, at 25°C. (A) AFHH-WT ribozyme. (B) Partially disrupted AFHH-1A ribozyme. (C) Fully disrupted AFHH-2A ribozyme. (D–F) Corresponding transition density plots for the same conditions as in A–C, showing the FRET states, transitions between those states, and specific transition rate constants determined by fitting time traces with the software HaMMy (McKinney et al. 2006) for AFHH-WT AFHH (80 molecules; D), partially disrupted mutant AFHH-1A (84 molecules; E) and fully disrupted mutant AFHH-2A (49 molecules; F).

