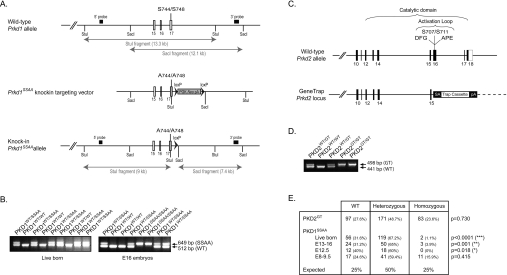
Figure 2. Generation of PKD2 gene-trap mutant mice and PKD1-knockin mutant mice.
(A) Depiction of the endogenous mouse Prkd1 allele containing exons 15–17, the knockin construct and the targeted allele with the neomycin cassette removed by Cre recombinase. The white/grey rectangles represent exons and the black arrowheads represent LoxP sites. Thick black lines indicate the positions of the probes used for Southern blot analysis. The knockin allele containing the Ser744/Ser748 mutation in exon 16 is illustrated as a grey rectangle. (B) PKD1SSAA-knockin mice were genotyped by PCR-amplification of genomic DNA over the LoxP insertion site as described in the Materials and methods section. (C) Depiction of the wild-type Prkd2 allele and the gene-trap-targeted Prkd2 allele present in the E14Tg2a.4 ES cell line. This insertion disrupts the catalytic domain structure and deletes several key motifs that are important for catalysis and substrate binding (the DFG and APE motifs) as well as the Ser707 and Ser711 phosphorylation sites that are important for PKD2 activation. (D) PKD2GT mice were genotyped by PCR amplification of genomic DNA as described in the Materials and methods section. (E) Heterozygous matings for PKD2GT mice and for PKD1SSAA mice were set up, and the live progeny and PKD1SSAA-knockin embryos were genotyped as described in the Materials and methods section. The number (and percentage) of each genotype observed is shown, followed by its expected Mendelian frequency. The data were analysed using a χ2 test to determine statistical significance.

