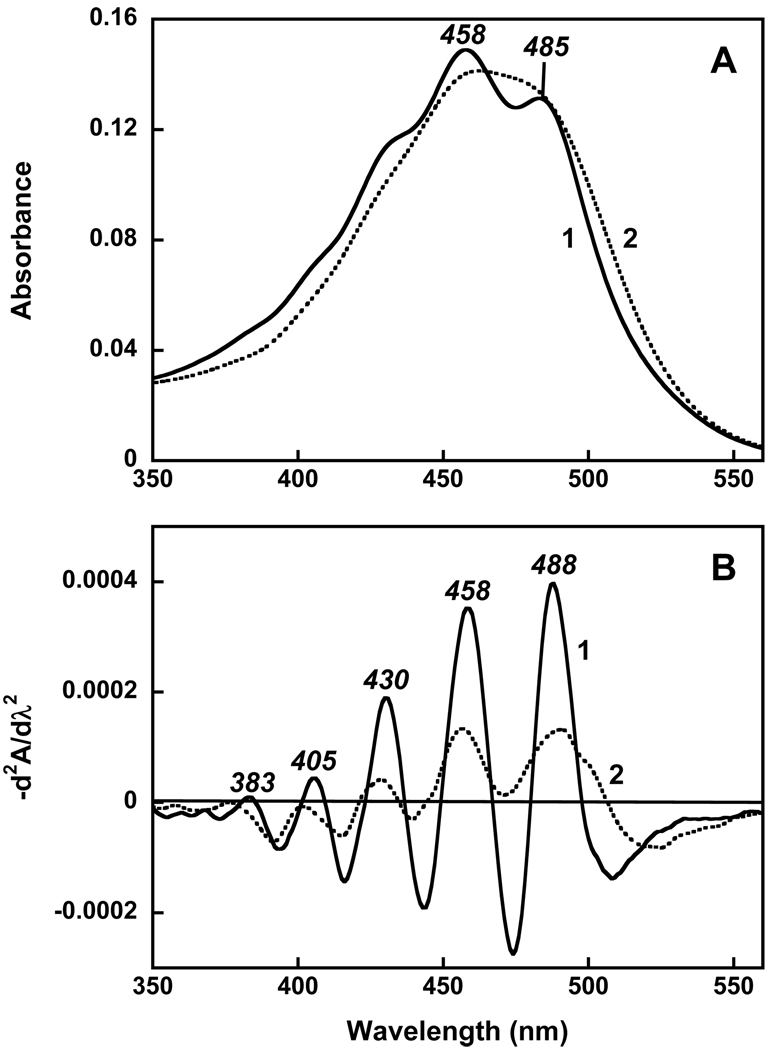
Figure 3.
A. Absorption spectra of echinenone: 1, bound to the protein (obtained as a difference between spectra 4 and 2 in Figure 2A); 2, in ethanol, normalized at 485 nm maximum. B. Second derivatives of the spectra shown in panel A, d2A/dλ2, multiplied by −1.

